Weekly Market Commentary
2024 Market Recap: Gains Amid Gaps
Posted on January 10, 2025
2024 Market Recap: Gains Amid Gaps
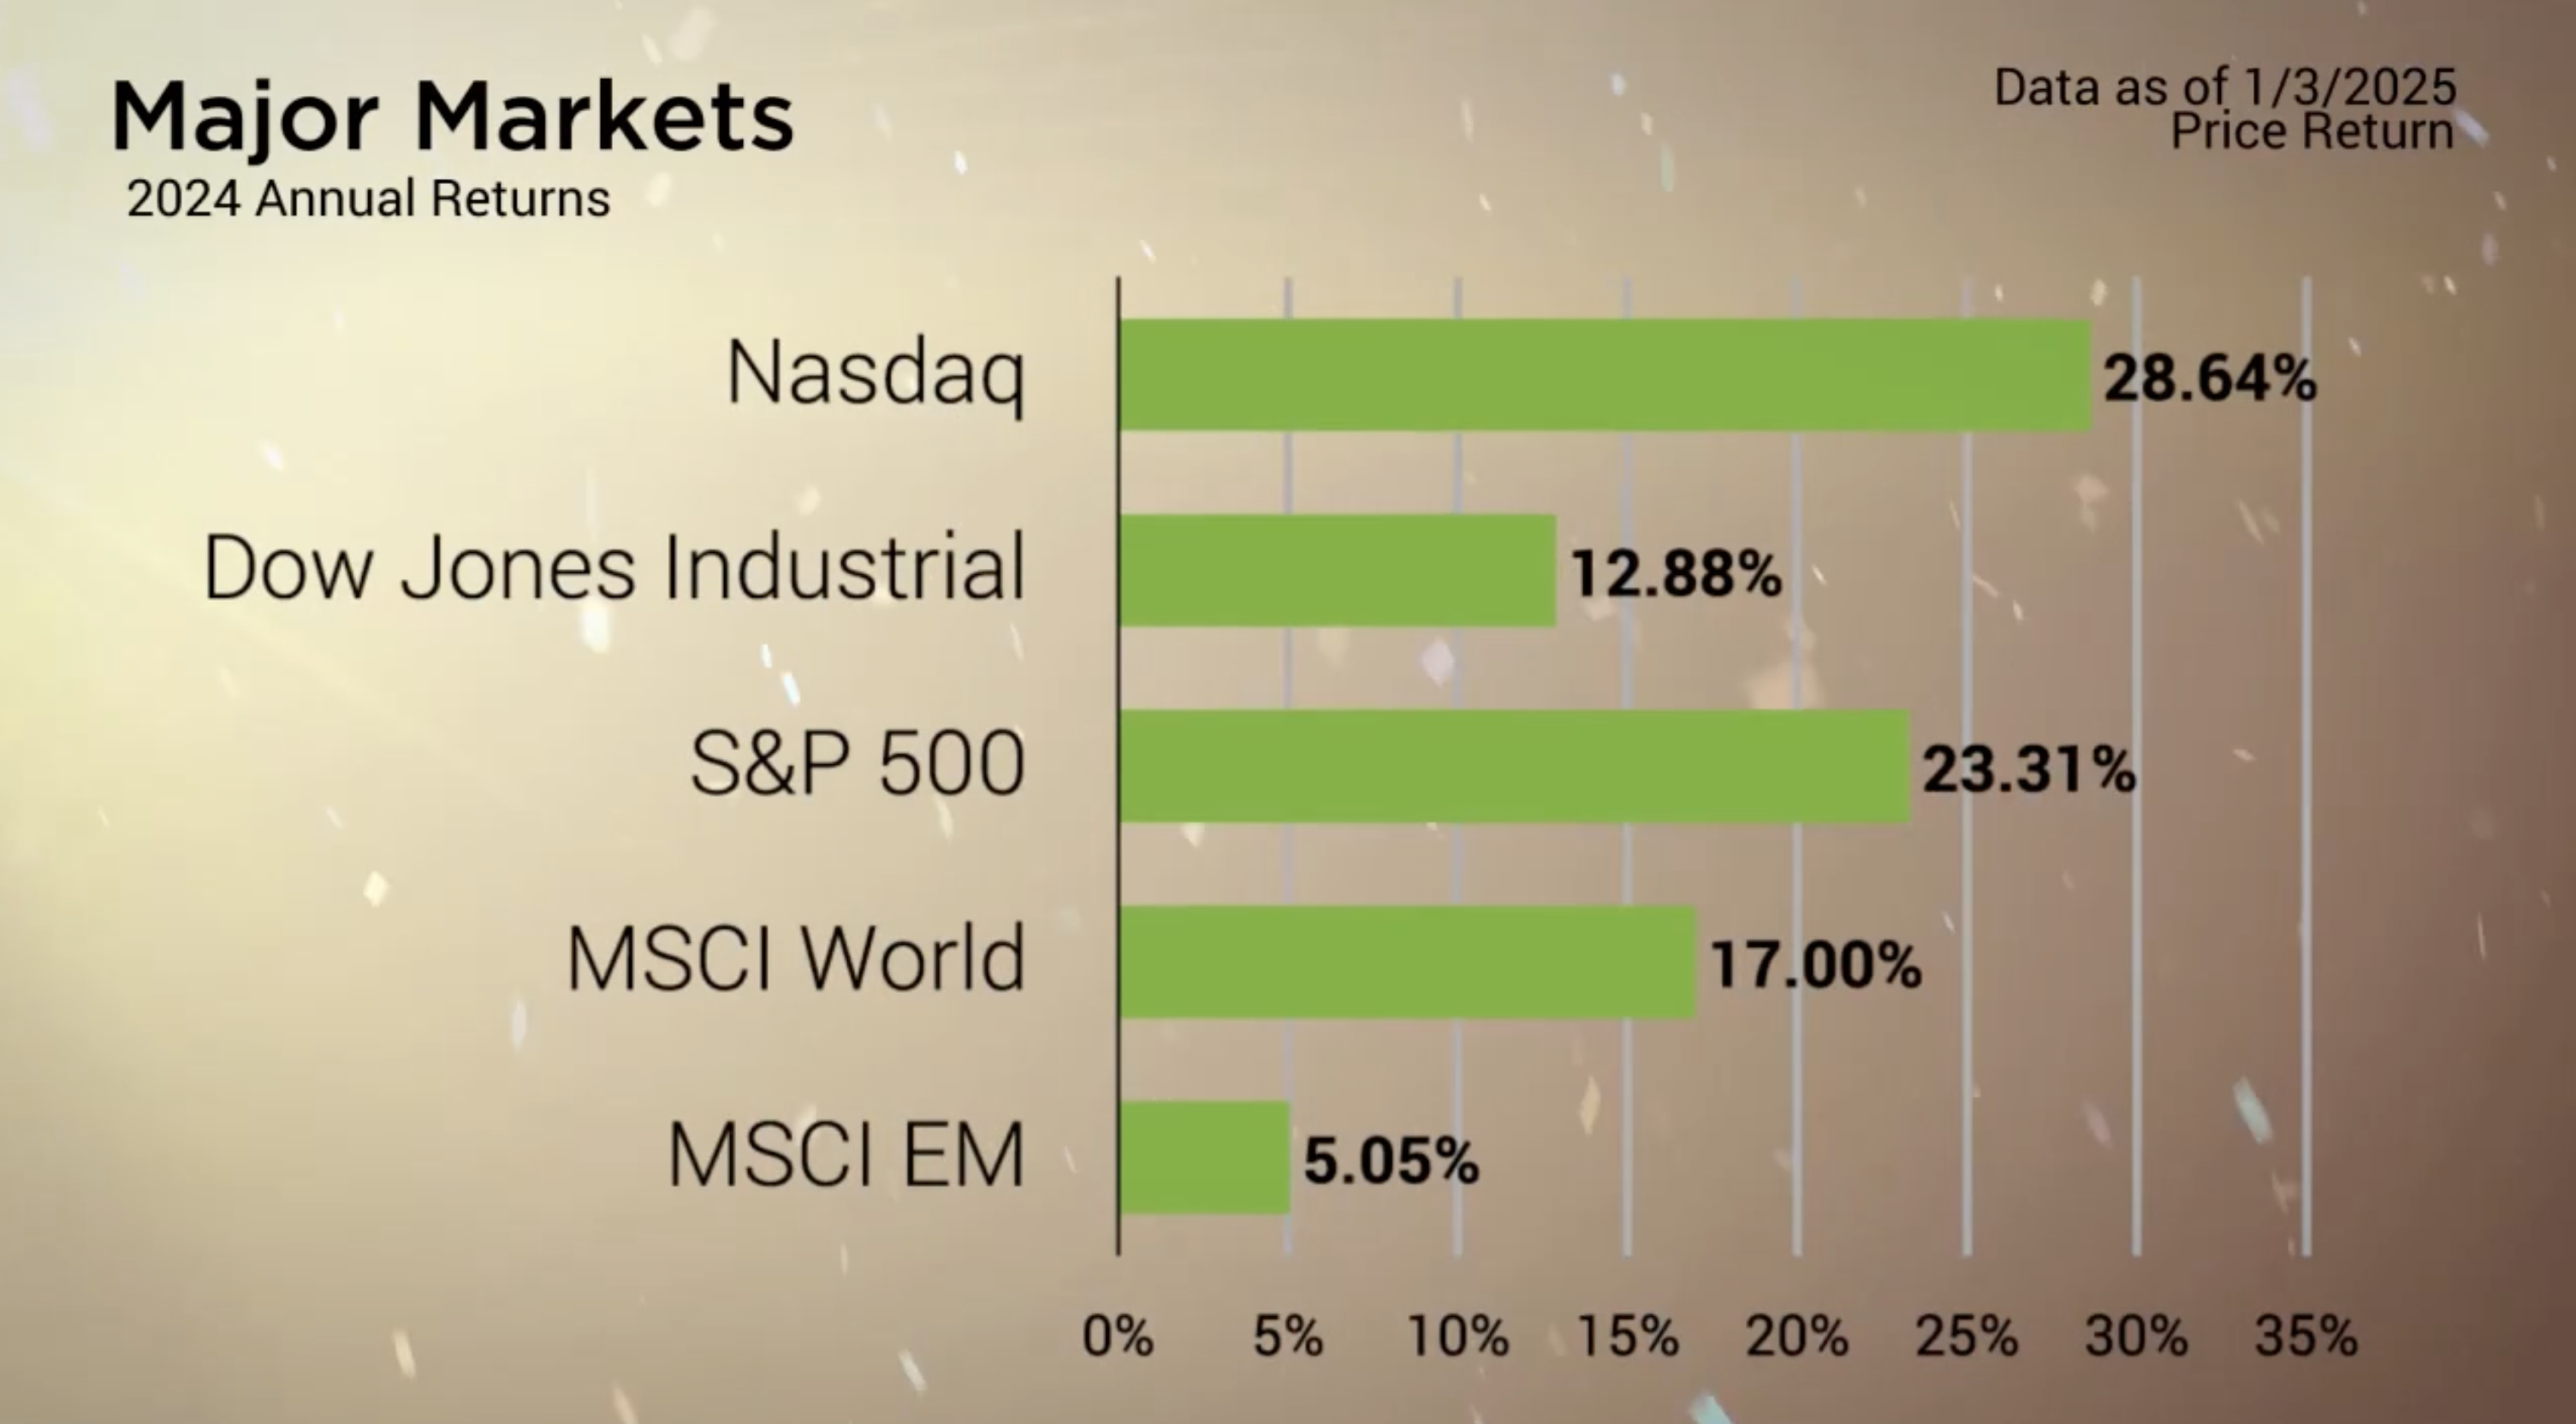
For the Major Markets, 2024 ended with gains across the board. The domestic market was the biggest winner with the Nasdaq Composite outperforming the rest of the domestic market. That said, the 23 percent return in the S&P 500 was a welcome result.
For the S&P 500, this doubles the average return of 9.48% going back to 1950. It also ranks as the 18th best annual return since then.
But as was seen throughout 2024, not every segment of the market saw significantly higher returns. As was already seen in the Nasdaq, Large Cap Growth oriented companies performed the best hands down with a gain of 35.15%. But the small and mid-cap segments struggled to keep up as the Small Cap 600 Value index added only 5.15% for the year.
This polarization was similarly seen at the Sector level with Materials falling behind as the lone negative performer for the year. While Communication Service and Information Technology, two of the largest components of the Nasdaq, exceeded 35% returns for the year.

Major Markets |
YTD as of 01/06/2024 | ||
| Nasdaq |  |
||
| Dow Jones Industrial |  |
||
| S&P 500 |  |
||
| MSCI World |  |
||
| MSCI EM |  |
||
| Russell 2000 |  |
||
| Bar US Agg Bnd |  |
||
 |
|||
S&P Sectors |
|
|||||
| Comm. Services |  |
|||||
| Cons. Discretionary |  |
|||||
| Cons. Staples |  |
|||||
| Energy |  |
|||||
| Financials |  |
|||||
| Health Care |  |
|||||
| Industrials |  |
|||||
| Info. Technology |  |
|||||
| Materials |  |
|||||
| Real Estate |  |
|||||
| Utilities |  |
|||||
 |
||||||
| Agent/Broker Dealer Use Only | ||||||
After three rate cuts that removed a percentage point in total from the Fed Funds rate, the rate closed out the year with the target range sitting between 4.25 and 4.5 percent. For the bond market, the slightly more favorable interest rate conditions didn’t necessarily translate to significant performance with the greater bond market indices.
The Bloomberg Barclays Aggregate Bond index ended the year with a minor gain of 1.25%. This was an amount that at times was less than a given week’s total performance. Meanwhile, the lower quality rated corporate bonds and various High Yield bond indices saw a respectable 5 to 8 percentage point return for the year. But last week’s conclusion to the year also contained the beginning of 2025 as well as the end of the Santa Claus Rally period.
“A Santa Claus rally refers to the sustained increases found in the stock market during the last five trading days of December through the first two trading days of January.”
This year, the Santa Claus rally started strong on Christmas Eve with a gain of a percentage point but was promptly followed by five sessions of losses. As a result, this year’s Santa Claus rally resulted in a loss of -0.53% and was more filled with coal than delight.
https://www.investopedia.com/terms/s/santaclauseffect.asp
Concerned about inflation? Check out our Tips to Reduce Risks In Case of Recession.
| The S&P 500® Index is a capitalization index of 500 stock-designed to measure performance of the broad domestic economy through changes in the aggregate market value of stock representing all major industries. https://us.spindices.com/indices/equity/sp-500 The Dow Jones Industrial Average® (The Dow®), is a price-weighted measure of 30 U.S. blue-chip companies. The index covers all industries except transportation and utilities. https://us.spindices.com/indices/equity/dow-jones-industrial-average The NASDAQ Composite Index measures all NASDAQ domestic and international based common type stocks listed on The NASDAQ Stock Market. Today the NASDAQ Composite includes over 2,500 companies, more than most other stock market indexes. Because it is so broad-based, the Composite is one of the most widely followed and quoted major market indexes. https://indexes.nasdaqomx.com/Index/Overview/COMP The MSCI World Index, which is part of The Modern Index Strategy, is a broad global equity benchmark that represents large and mid-cap equity performance across 23 developed markets countries. It covers approximately 85% of the free float-adjusted market capitalization in each country and MSCI World benchmark does not offer exposure to emerging markets. The MSCI Emerging Markets (EM) Index is designed to represent the performance of large- and mid-cap securities in 24 Emerging Markets countries of the Americas, Europe, the Middle East, Africa and Asia. As of December 2017, it had more than 830 constituents and covered approximately 85% of the free float-adjusted market capitalization in each country. https://www.msci.com/ The S&P GSCI Crude Oil index provides investors with a reliable and publicly available benchmark for investment performance in the crude oil market. https://us.spindices.com/indices Companies in the S&P 500 Sector Indices are classified based on the Global Industry Classification Standard (GICS®). https://us.spindices.com/indices |


