


 Our Leadership Team
 Find An Advisor
 Our Platform
 Advisory
 Alternatives
 Insurance
 Specialized Services
 Individual Investors
 Retirees
 Business Owners
 Family Offices & Institutions
 Doctors
 Tenants
 Accountants
Weekly Market Commentary
A Speech by Fed Chairman Jerome Powell
Posted on October 23, 2023
Market Commentary by Mitchell Wood, Larson COO
| The Major Markets saw red again last week as all five indices fell. For the Nasdaq, which saw the greatest pullback, this stands as the second consecutive week of declines and the eighth week out of the last 12 that closed lower. |
Major Markets |
YTD as of 10/20/2023 | ||
| Nasdaq |  |
||
| Dow Jones Industrial |  |
||
| S&P 500 |  |
||
| MSCI World |  |
||
| MSCI EM |  |
||
| Russell 2000 |  |
||
| Bar US Agg Bnd |  |
||
 |
|||
S&P Sectors |
|
|||||
| Comm. Services |  |
|||||
| Cons. Discretionary |  |
|||||
| Cons. Staples |  |
|||||
| Energy |  |
|||||
| Financials |  |
|||||
| Health Care |  |
|||||
| Industrials |  |
|||||
| Info. Technology |  |
|||||
| Materials |  |
|||||
| Real Estate |  |
|||||
| Utilities |  |
|||||
 |
||||||
| Agent/Broker Dealer Use Only | ||||||
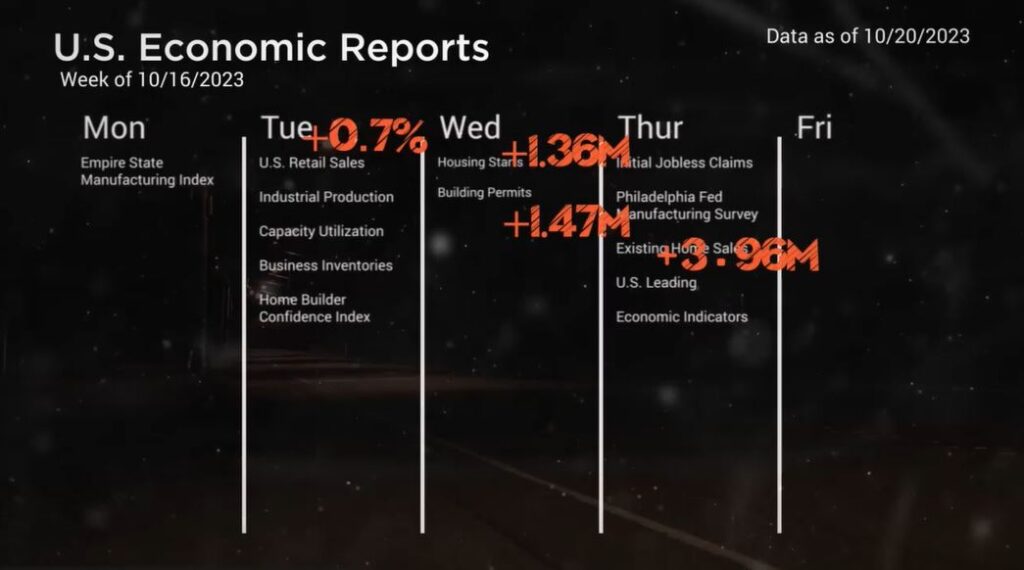
| The dominant economic news last week was around the topic of inflation. Retail Sales came in hotter than expected on Tuesday. On Wednesday, Housing Starts came in just slightly below expectations while Building Permits exceeded expectations. This was echoed on Thursday with Existing Home Sales which came in slightly above estimates. |
However, Thursday also held a speech by Fed Chairman Jerome Powell.
| In his comments at the New York Economic Club, Powell gave mixed messages about the future of interest rates. In his opening comments, he said: “My colleagues and I remain resolute in our commitment to returning inflation to two percent over time. A range of uncertainties, both old and new, complicate our task of balancing the risk of tightening monetary policy too much against the risk of tightening too little. Doing too little could allow above-target inflation to become entrenched and ultimately require monetary policy to wring more persistent inflation from the economy at a high cost to employment.” His comments were taken significantly more hawkish than recent perceptions. Following his speech, the longer end of the yield curve rose significantly higher. The 10-year crossed over the 5 percent mark at one-point intraday Thursday before settling at 4.93 for the week. However, this didn’t do much to change the overall picture of the upcoming FOMC Meeting rate probabilities. Possibly the most noteworthy aspect of the upcoming schedule is that the market has virtually fully priced in that rates will remain static at the All-Saints’ Day FOMC Meeting, with only a significant possibility of an additional rate increase in Q1 of next year. That said, there was enough action within the bond market to send bond indices deeply lower into the red. The Bloomberg Barclays Aggregate Bond Index fell roughly 1¾ percent last week alone, dropping the year-to-date performance to a loss exceeding 3 percentage points. https://www.federalreserve.gov/newsevents/speech/powell20231019a.htm |
Time for a financial checkup?
Click “Schedule a Consult” and get in touch today.
| The S&P 500® Index is a capitalization index of 500 stock-designed to measure performance of the broad domestic economy through changes in the aggregate market value of stock representing all major industries. https://us.spindices.com/indices/equity/sp-500 The Dow Jones Industrial Average® (The Dow®), is a price-weighted measure of 30 U.S. blue-chip companies. The index covers all industries except transportation and utilities. https://us.spindices.com/indices/equity/dow-jones-industrial-average The NASDAQ Composite Index measures all NASDAQ domestic and international based common type stocks listed on The NASDAQ Stock Market. Today the NASDAQ Composite includes over 2,500 companies, more than most other stock market indexes. Because it is so broad-based, the Composite is one of the most widely followed and quoted major market indexes. https://indexes.nasdaqomx.com/Index/Overview/COMP The MSCI World Index, which is part of The Modern Index Strategy, is a broad global equity benchmark that represents large and mid-cap equity performance across 23 developed markets countries. It covers approximately 85% of the free float-adjusted market capitalization in each country and MSCI World benchmark does not offer exposure to emerging markets. The MSCI Emerging Markets (EM) Index is designed to represent the performance of large- and mid-cap securities in 24 Emerging Markets countries of the Americas, Europe, the Middle East, Africa and Asia. As of December 2017, it had more than 830 constituents and covered approximately 85% of the free float-adjusted market capitalization in each country. https://www.msci.com/ The S&P GSCI Crude Oil index provides investors with a reliable and publicly available benchmark for investment performance in the crude oil market. https://us.spindices.com/indices Companies in the S&P 500 Sector Indices are classified based on the Global Industry Classification Standard (GICS®). https://us.spindices.com/indices |


