


 Our Leadership Team
 Find An Advisor
 Our Platform
 Advisory
 Alternatives
 Insurance
 Specialized Services
 Individual Investors
 Retirees
 Business Owners
 Family Offices & Institutions
 Doctors
 Tenants
 Accountants
Weekly Market Commentary
Dow Leads Market Surge
Posted on May 16, 2024
The Major Markets all saw green last week. The Dow Jones saw the greatest gains followed by the S&P 500 and the MSCI World Index. The gains in the S&P 500 brought the blue-chip index back above the 5200 level for the first time in a month. Moreover, this caused the large cap index to trade back within a percentage point of its prior all-time high.
The green was widespread across the sectors as all 11 sectors saw gains. The weakness in Consumer Discretionary as well as Information technology resulted in a timid return in the NASDAQ Composite. That said, last week’s gains also brought the tech index back within a percentage point of its all-time high.
Earnings were in full swing last week as the largest number of companies reported. Yet, even some of the notable drops like Disney’s 6.9% weekly loss was not enough to derail the optimism of the overall market.
Major Markets |
YTD as of 5/10/2024 | ||
| Nasdaq |  |
||
| Dow Jones Industrial |  |
||
| S&P 500 |  |
||
| MSCI World |  |
||
| MSCI EM |  |
||
| Russell 2000 |  |
||
| Bar US Agg Bnd |  |
||
 |
|||
S&P Sectors |
|
|||||
| Comm. Services |  |
|||||
| Cons. Discretionary |  |
|||||
| Cons. Staples |  |
|||||
| Energy |  |
|||||
| Financials |  |
|||||
| Health Care |  |
|||||
| Industrials |  |
|||||
| Info. Technology |  |
|||||
| Materials |  |
|||||
| Real Estate |  |
|||||
| Utilities |  |
|||||
 |
||||||
| Agent/Broker Dealer Use Only | ||||||
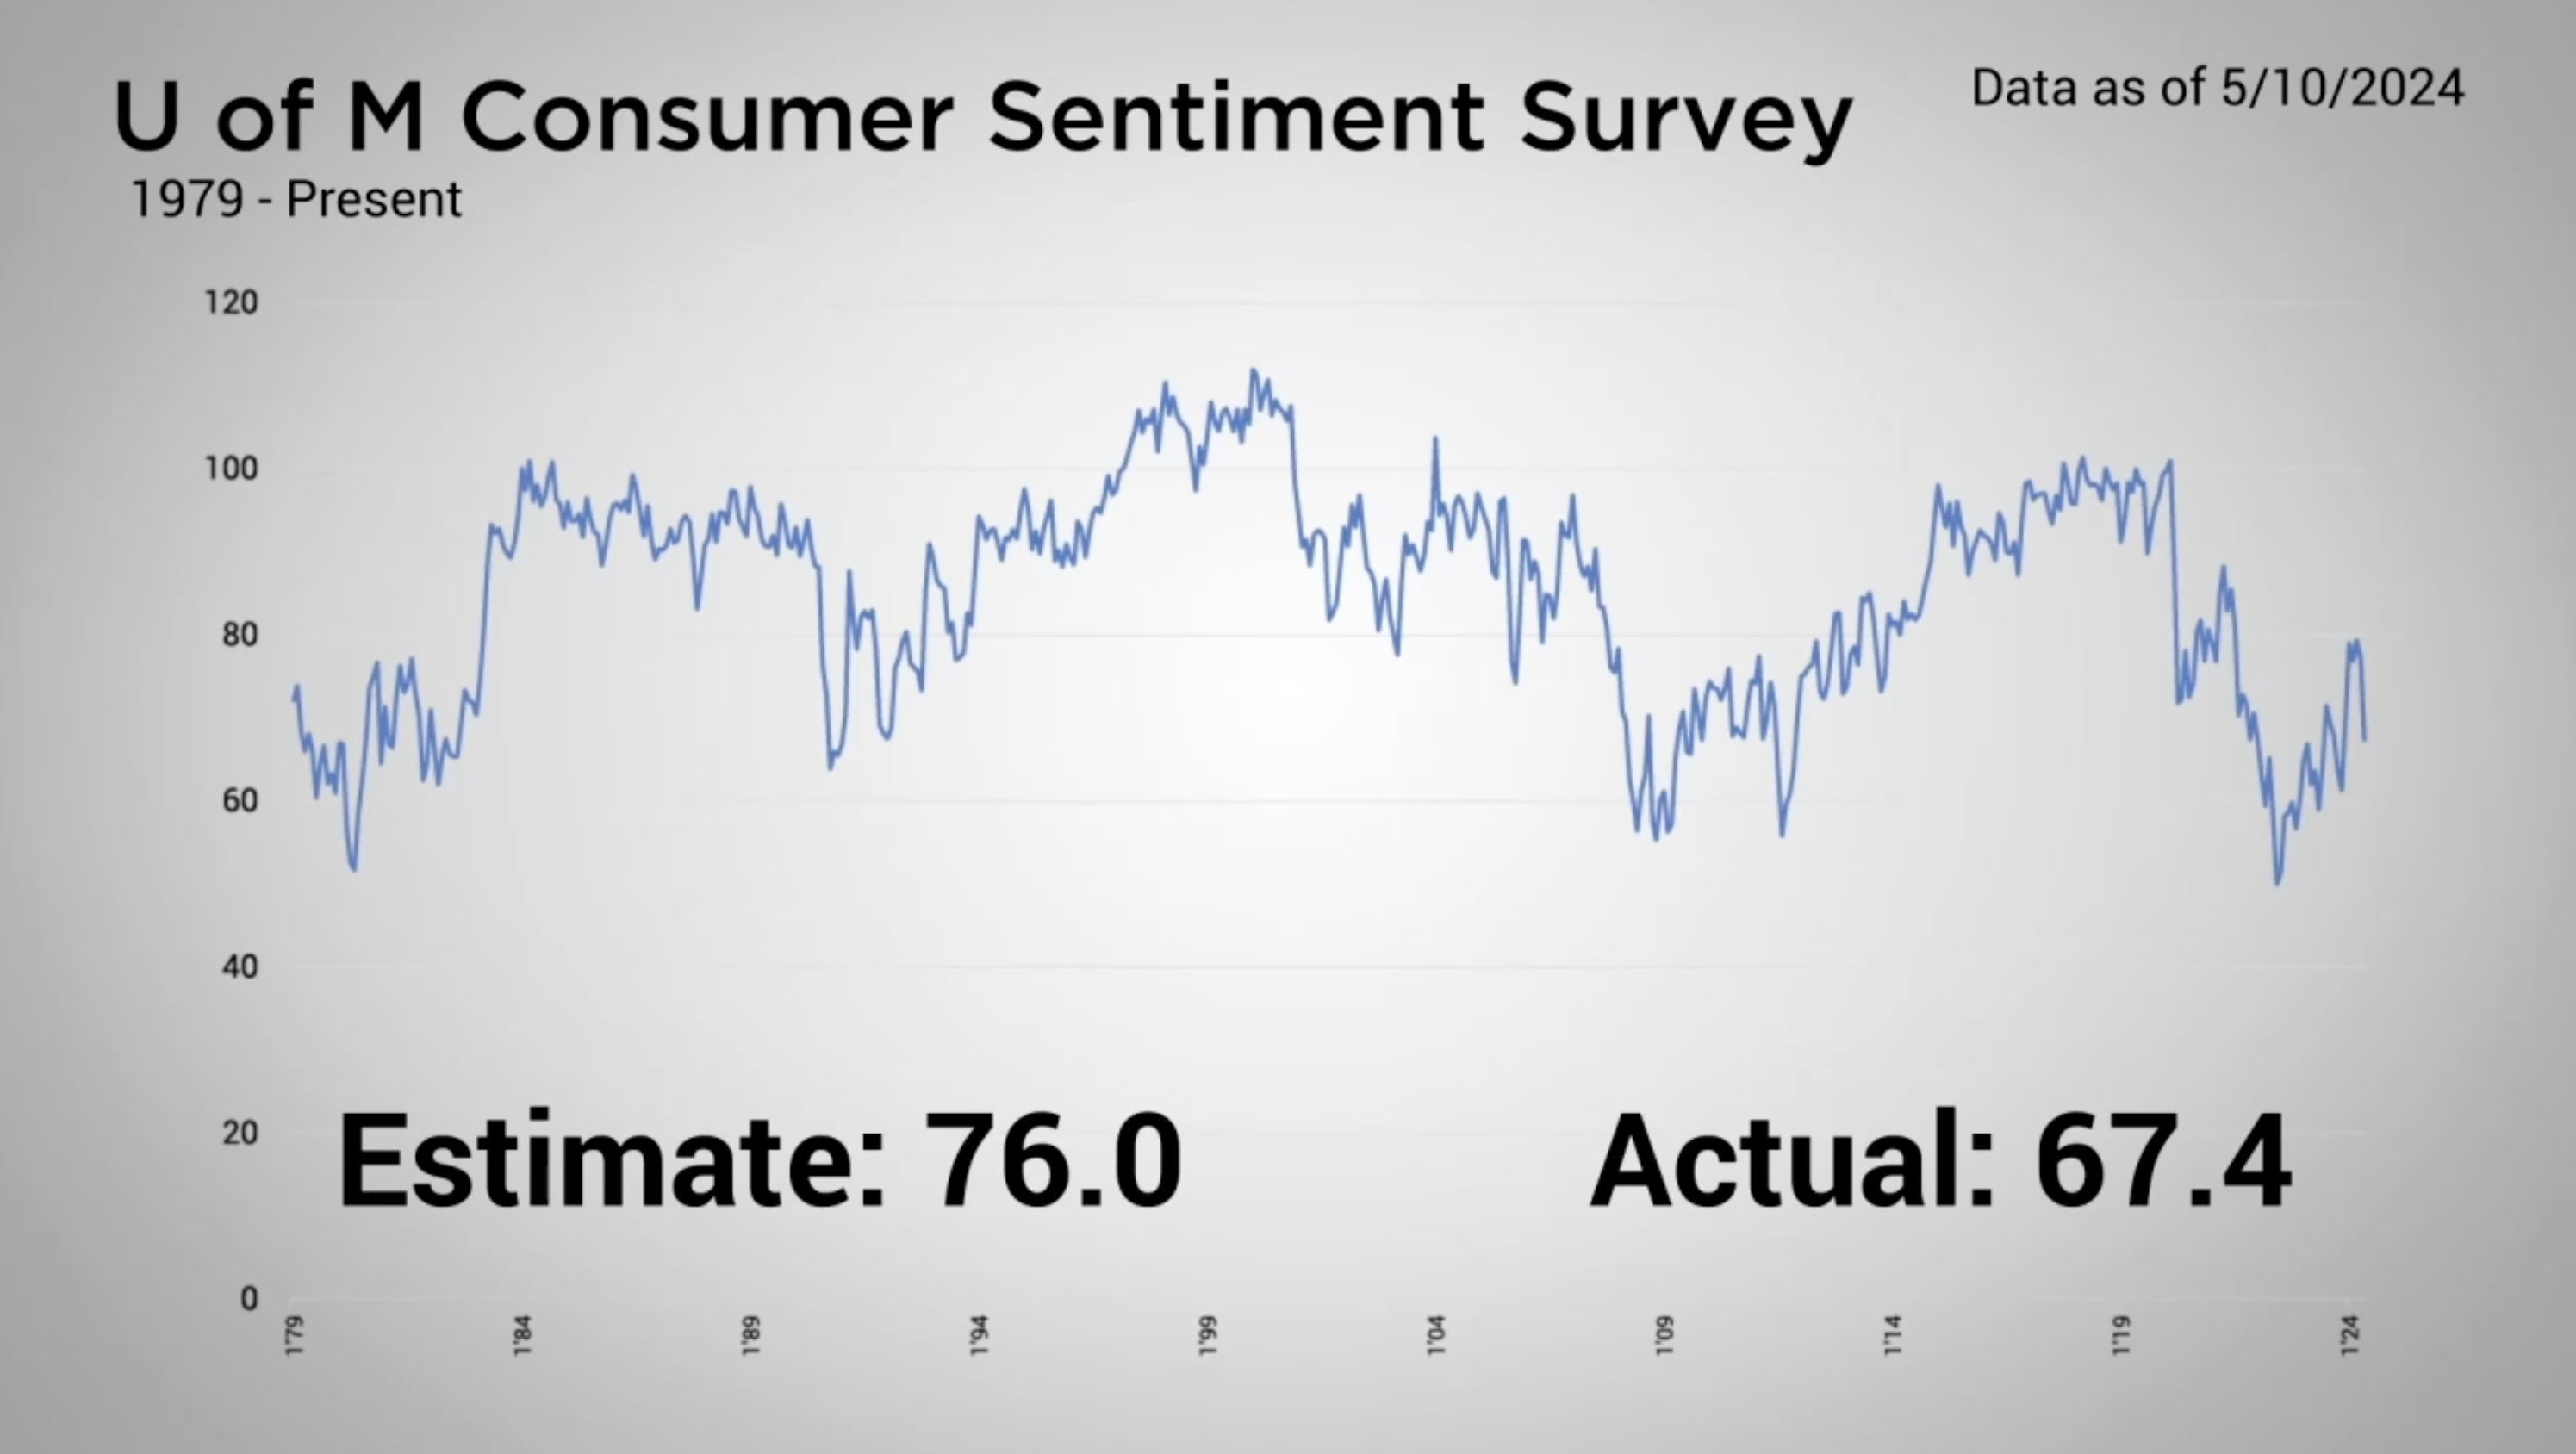
The economic calendar had little to steer sentiment last week. One notable report last week was the University of Michigan Consumer Sentiment report. The report saw the biggest miss in the history of the survey. The drop in sentiment was consistent across ages, income, and education groups showing an overall displeasure with current conditions and expectations of inflation, unemployment, and interest rates moving in an unfavorable direction.
Nevertheless, the yield curve remained fairly static and equities stayed strong going into the weekend.
Concerned about inflation? Check out our Tips to Reduce Risks In Case of Recession.
| The S&P 500® Index is a capitalization index of 500 stock-designed to measure performance of the broad domestic economy through changes in the aggregate market value of stock representing all major industries. https://us.spindices.com/indices/equity/sp-500 The Dow Jones Industrial Average® (The Dow®), is a price-weighted measure of 30 U.S. blue-chip companies. The index covers all industries except transportation and utilities. https://us.spindices.com/indices/equity/dow-jones-industrial-average The NASDAQ Composite Index measures all NASDAQ domestic and international based common type stocks listed on The NASDAQ Stock Market. Today the NASDAQ Composite includes over 2,500 companies, more than most other stock market indexes. Because it is so broad-based, the Composite is one of the most widely followed and quoted major market indexes. https://indexes.nasdaqomx.com/Index/Overview/COMP The MSCI World Index, which is part of The Modern Index Strategy, is a broad global equity benchmark that represents large and mid-cap equity performance across 23 developed markets countries. It covers approximately 85% of the free float-adjusted market capitalization in each country and MSCI World benchmark does not offer exposure to emerging markets. The MSCI Emerging Markets (EM) Index is designed to represent the performance of large- and mid-cap securities in 24 Emerging Markets countries of the Americas, Europe, the Middle East, Africa and Asia. As of December 2017, it had more than 830 constituents and covered approximately 85% of the free float-adjusted market capitalization in each country. https://www.msci.com/ The S&P GSCI Crude Oil index provides investors with a reliable and publicly available benchmark for investment performance in the crude oil market. https://us.spindices.com/indices Companies in the S&P 500 Sector Indices are classified based on the Global Industry Classification Standard (GICS®). https://us.spindices.com/indices |


