Weekly Market Commentary
Holiday Market Wrap: Mixed Results for S&P 500
Posted on January 2, 2025
Holiday Market Wrap: Mixed Results for S&P 500
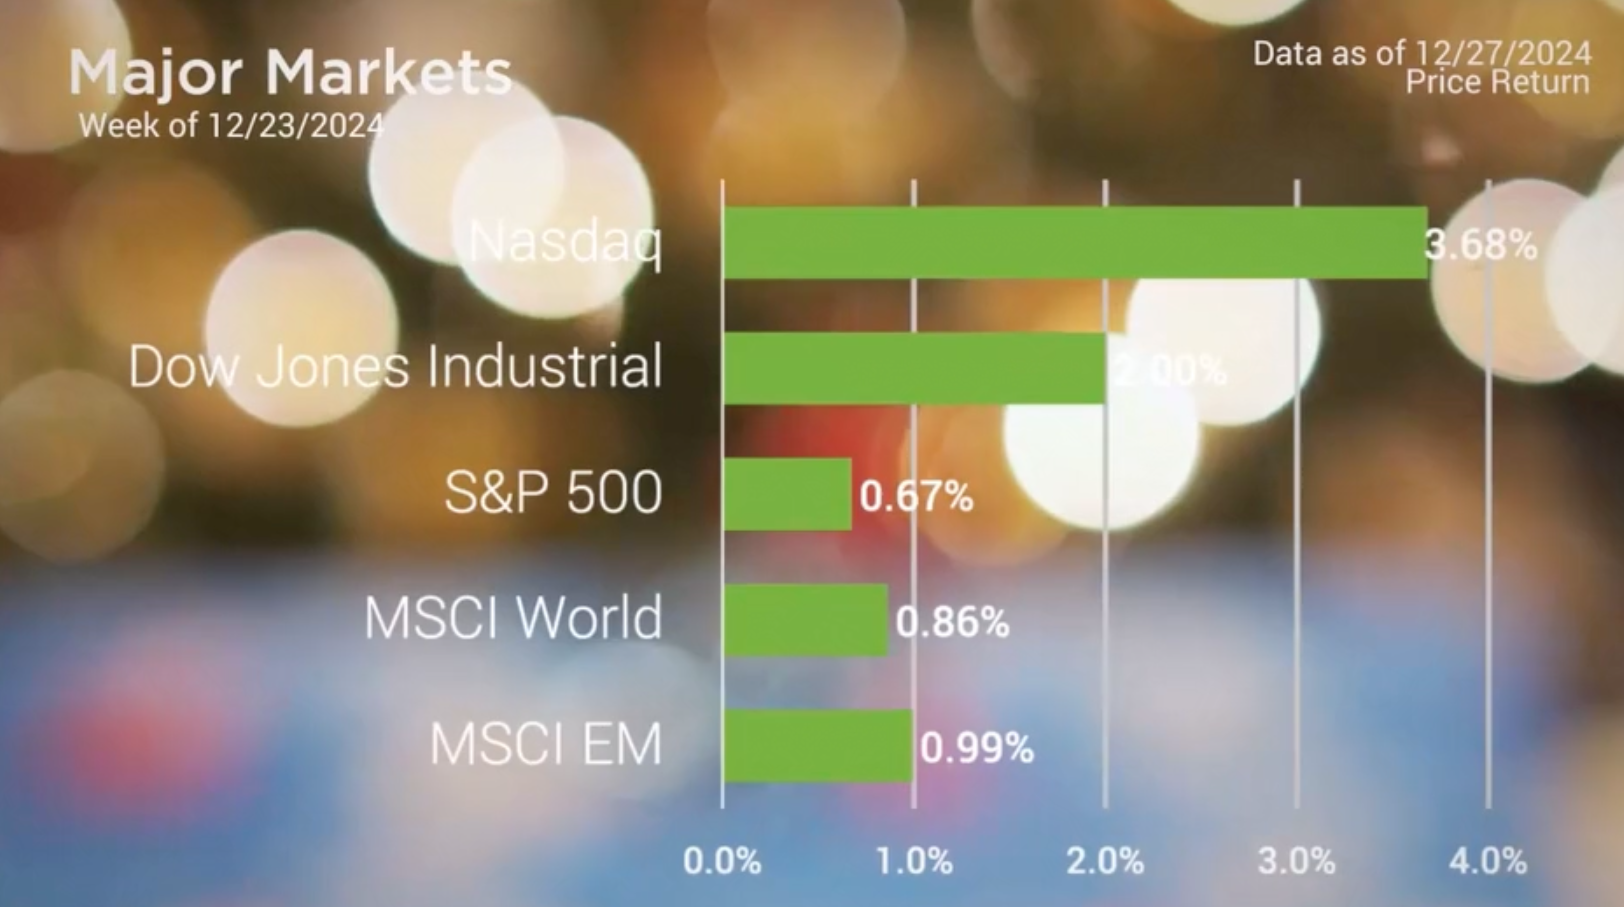
The Christmas shortened trading week ended on a positive note, but the period surrounding the holiday was marked by a fair amount of decline.
The week before Christmas saw a drop of 2 percent in the S&P 500. This week was highlighted by the final FOMC Meeting of the year on December 17th and 18th. During his post-meeting press conference on Wednesday, Fed Chairman Jerome Powell adopted a significantly more hawkish tone, despite the Fed’s decision to cut the federal funds rate by 25 basis points to a range of 4.25% to 4.50%. This shift in tone led to a substantial market decline, with the S&P 500 falling by 2.95% on that day alone.
The CME Group’s FedWatch Tool reflects this more hawkish stance, indicating that the market has priced in one more 25 basis point cut at the beginning of the new year, will little expectations of another cut until sometime later in 2025.
Following the sell-off on Wednesday the 18th, the market experienced some gains on Friday and in the days leading up to Christmas. However, Boxing Day saw little change in the S&P 500, and the Friday after Christmas brought another drop in the markets. This decline dampened the anticipation of a Santa Claus rally this year.

Major Markets |
YTD as of 12/27/2024 | ||
| Nasdaq |  |
||
| Dow Jones Industrial |  |
||
| S&P 500 |  |
||
| MSCI World |  |
||
| MSCI EM |  |
||
| Russell 2000 |  |
||
| Bar US Agg Bnd |  |
||
 |
|||
S&P Sectors |
|
|||||
| Comm. Services |  |
|||||
| Cons. Discretionary |  |
|||||
| Cons. Staples |  |
|||||
| Energy |  |
|||||
| Financials |  |
|||||
| Health Care |  |
|||||
| Industrials |  |
|||||
| Info. Technology |  |
|||||
| Materials |  |
|||||
| Real Estate |  |
|||||
| Utilities |  |
|||||
 |
||||||
| Agent/Broker Dealer Use Only | ||||||
This week, the market will again be affected by the holidays, as it will be closed for New Year’s Day. A more normalized trading schedule will resume next week. We’d like to wish you a safe and Happy New Year!
Concerned about inflation? Check out our Tips to Reduce Risks In Case of Recession.
| The S&P 500® Index is a capitalization index of 500 stock-designed to measure performance of the broad domestic economy through changes in the aggregate market value of stock representing all major industries. https://us.spindices.com/indices/equity/sp-500 The Dow Jones Industrial Average® (The Dow®), is a price-weighted measure of 30 U.S. blue-chip companies. The index covers all industries except transportation and utilities. https://us.spindices.com/indices/equity/dow-jones-industrial-average The NASDAQ Composite Index measures all NASDAQ domestic and international based common type stocks listed on The NASDAQ Stock Market. Today the NASDAQ Composite includes over 2,500 companies, more than most other stock market indexes. Because it is so broad-based, the Composite is one of the most widely followed and quoted major market indexes. https://indexes.nasdaqomx.com/Index/Overview/COMP The MSCI World Index, which is part of The Modern Index Strategy, is a broad global equity benchmark that represents large and mid-cap equity performance across 23 developed markets countries. It covers approximately 85% of the free float-adjusted market capitalization in each country and MSCI World benchmark does not offer exposure to emerging markets. The MSCI Emerging Markets (EM) Index is designed to represent the performance of large- and mid-cap securities in 24 Emerging Markets countries of the Americas, Europe, the Middle East, Africa and Asia. As of December 2017, it had more than 830 constituents and covered approximately 85% of the free float-adjusted market capitalization in each country. https://www.msci.com/ The S&P GSCI Crude Oil index provides investors with a reliable and publicly available benchmark for investment performance in the crude oil market. https://us.spindices.com/indices Companies in the S&P 500 Sector Indices are classified based on the Global Industry Classification Standard (GICS®). https://us.spindices.com/indices |


