Weekly Market Commentary
Largest Gains for the S&P 500 in 51 Weeks
Posted on November 6, 2023
Market Commentary by Mitchell Wood, Larson COO
| The Major Markets saw new life last week after two weeks of losses. Moreover, the gains were significant as the Nasdaq added over 6.5 percent with the S&P 500 adding 5.85 percent as well. For the S&P 500, this marked the largest gains in 51 weeks, as the last time the index added this amount was almost exactly a year ago. |

Major Markets |
YTD as of 11/03/2023 | ||
| Nasdaq |  |
||
| Dow Jones Industrial |  |
||
| S&P 500 |  |
||
| MSCI World |  |
||
| MSCI EM |  |
||
| Russell 2000 |  |
||
| Bar US Agg Bnd |  |
||
 |
|||
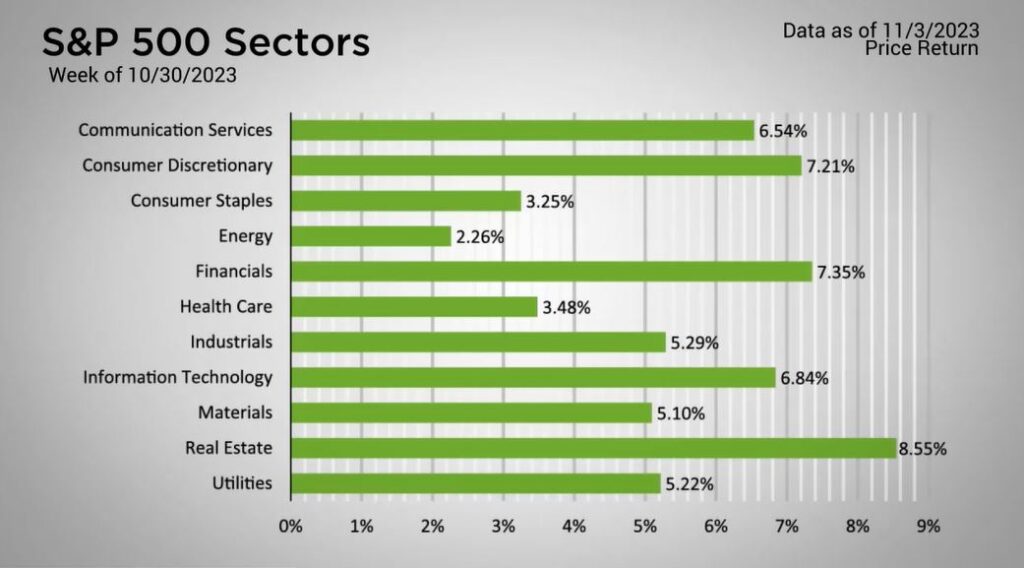
S&P Sectors |
|
|||||
| Comm. Services |  |
|||||
| Cons. Discretionary |  |
|||||
| Cons. Staples |  |
|||||
| Energy |  |
|||||
| Financials |  |
|||||
| Health Care |  |
|||||
| Industrials |  |
|||||
| Info. Technology |  |
|||||
| Materials |  |
|||||
| Real Estate |  |
|||||
| Utilities |  |
|||||
 |
||||||
| Agent/Broker Dealer Use Only | ||||||
The gains were broad based as all 11 sectors closed higher. This was also true in all nine style boxes, and even the bond indices.
The positive sentiment came in a combination of pieces.
| First, the FOMC met on Halloween and All Saints Day midweek and held interest rates steady at the present levels. Additionally, Fed Chairman Jerome Powell’s comments were viewed as less hawkish and therefore took some of the fear away from interest rates rising further. This was seen clearly within the CME Group’s Fed Watch tool. Previously, there was a significant possibility of another interest rate hike in Q1 of 2024. However, as of Friday, the odds of higher interest rates were around 15 percent or less. This took a significant amount of pressure off of the yield curve which dropped by as much as 28 basis points in the seven-year duration. This accommodative tone was well-received by the markets. Especially so, given that some notable earnings releases missed the mark. That said this week holds the largest amount of companies reporting before things begin to wind up at the end of earnings season. https://www.cnbc.com/2023/11/01/fed-meeting-november-2023-.html |
Time for a financial checkup?
Click “Schedule a Consult” and get in touch today.
| The S&P 500® Index is a capitalization index of 500 stock-designed to measure performance of the broad domestic economy through changes in the aggregate market value of stock representing all major industries. https://us.spindices.com/indices/equity/sp-500 The Dow Jones Industrial Average® (The Dow®), is a price-weighted measure of 30 U.S. blue-chip companies. The index covers all industries except transportation and utilities. https://us.spindices.com/indices/equity/dow-jones-industrial-average The NASDAQ Composite Index measures all NASDAQ domestic and international based common type stocks listed on The NASDAQ Stock Market. Today the NASDAQ Composite includes over 2,500 companies, more than most other stock market indexes. Because it is so broad-based, the Composite is one of the most widely followed and quoted major market indexes. https://indexes.nasdaqomx.com/Index/Overview/COMP The MSCI World Index, which is part of The Modern Index Strategy, is a broad global equity benchmark that represents large and mid-cap equity performance across 23 developed markets countries. It covers approximately 85% of the free float-adjusted market capitalization in each country and MSCI World benchmark does not offer exposure to emerging markets. The MSCI Emerging Markets (EM) Index is designed to represent the performance of large- and mid-cap securities in 24 Emerging Markets countries of the Americas, Europe, the Middle East, Africa and Asia. As of December 2017, it had more than 830 constituents and covered approximately 85% of the free float-adjusted market capitalization in each country. https://www.msci.com/ The S&P GSCI Crude Oil index provides investors with a reliable and publicly available benchmark for investment performance in the crude oil market. https://us.spindices.com/indices Companies in the S&P 500 Sector Indices are classified based on the Global Industry Classification Standard (GICS®). https://us.spindices.com/indices |


