Weekly Market Commentary
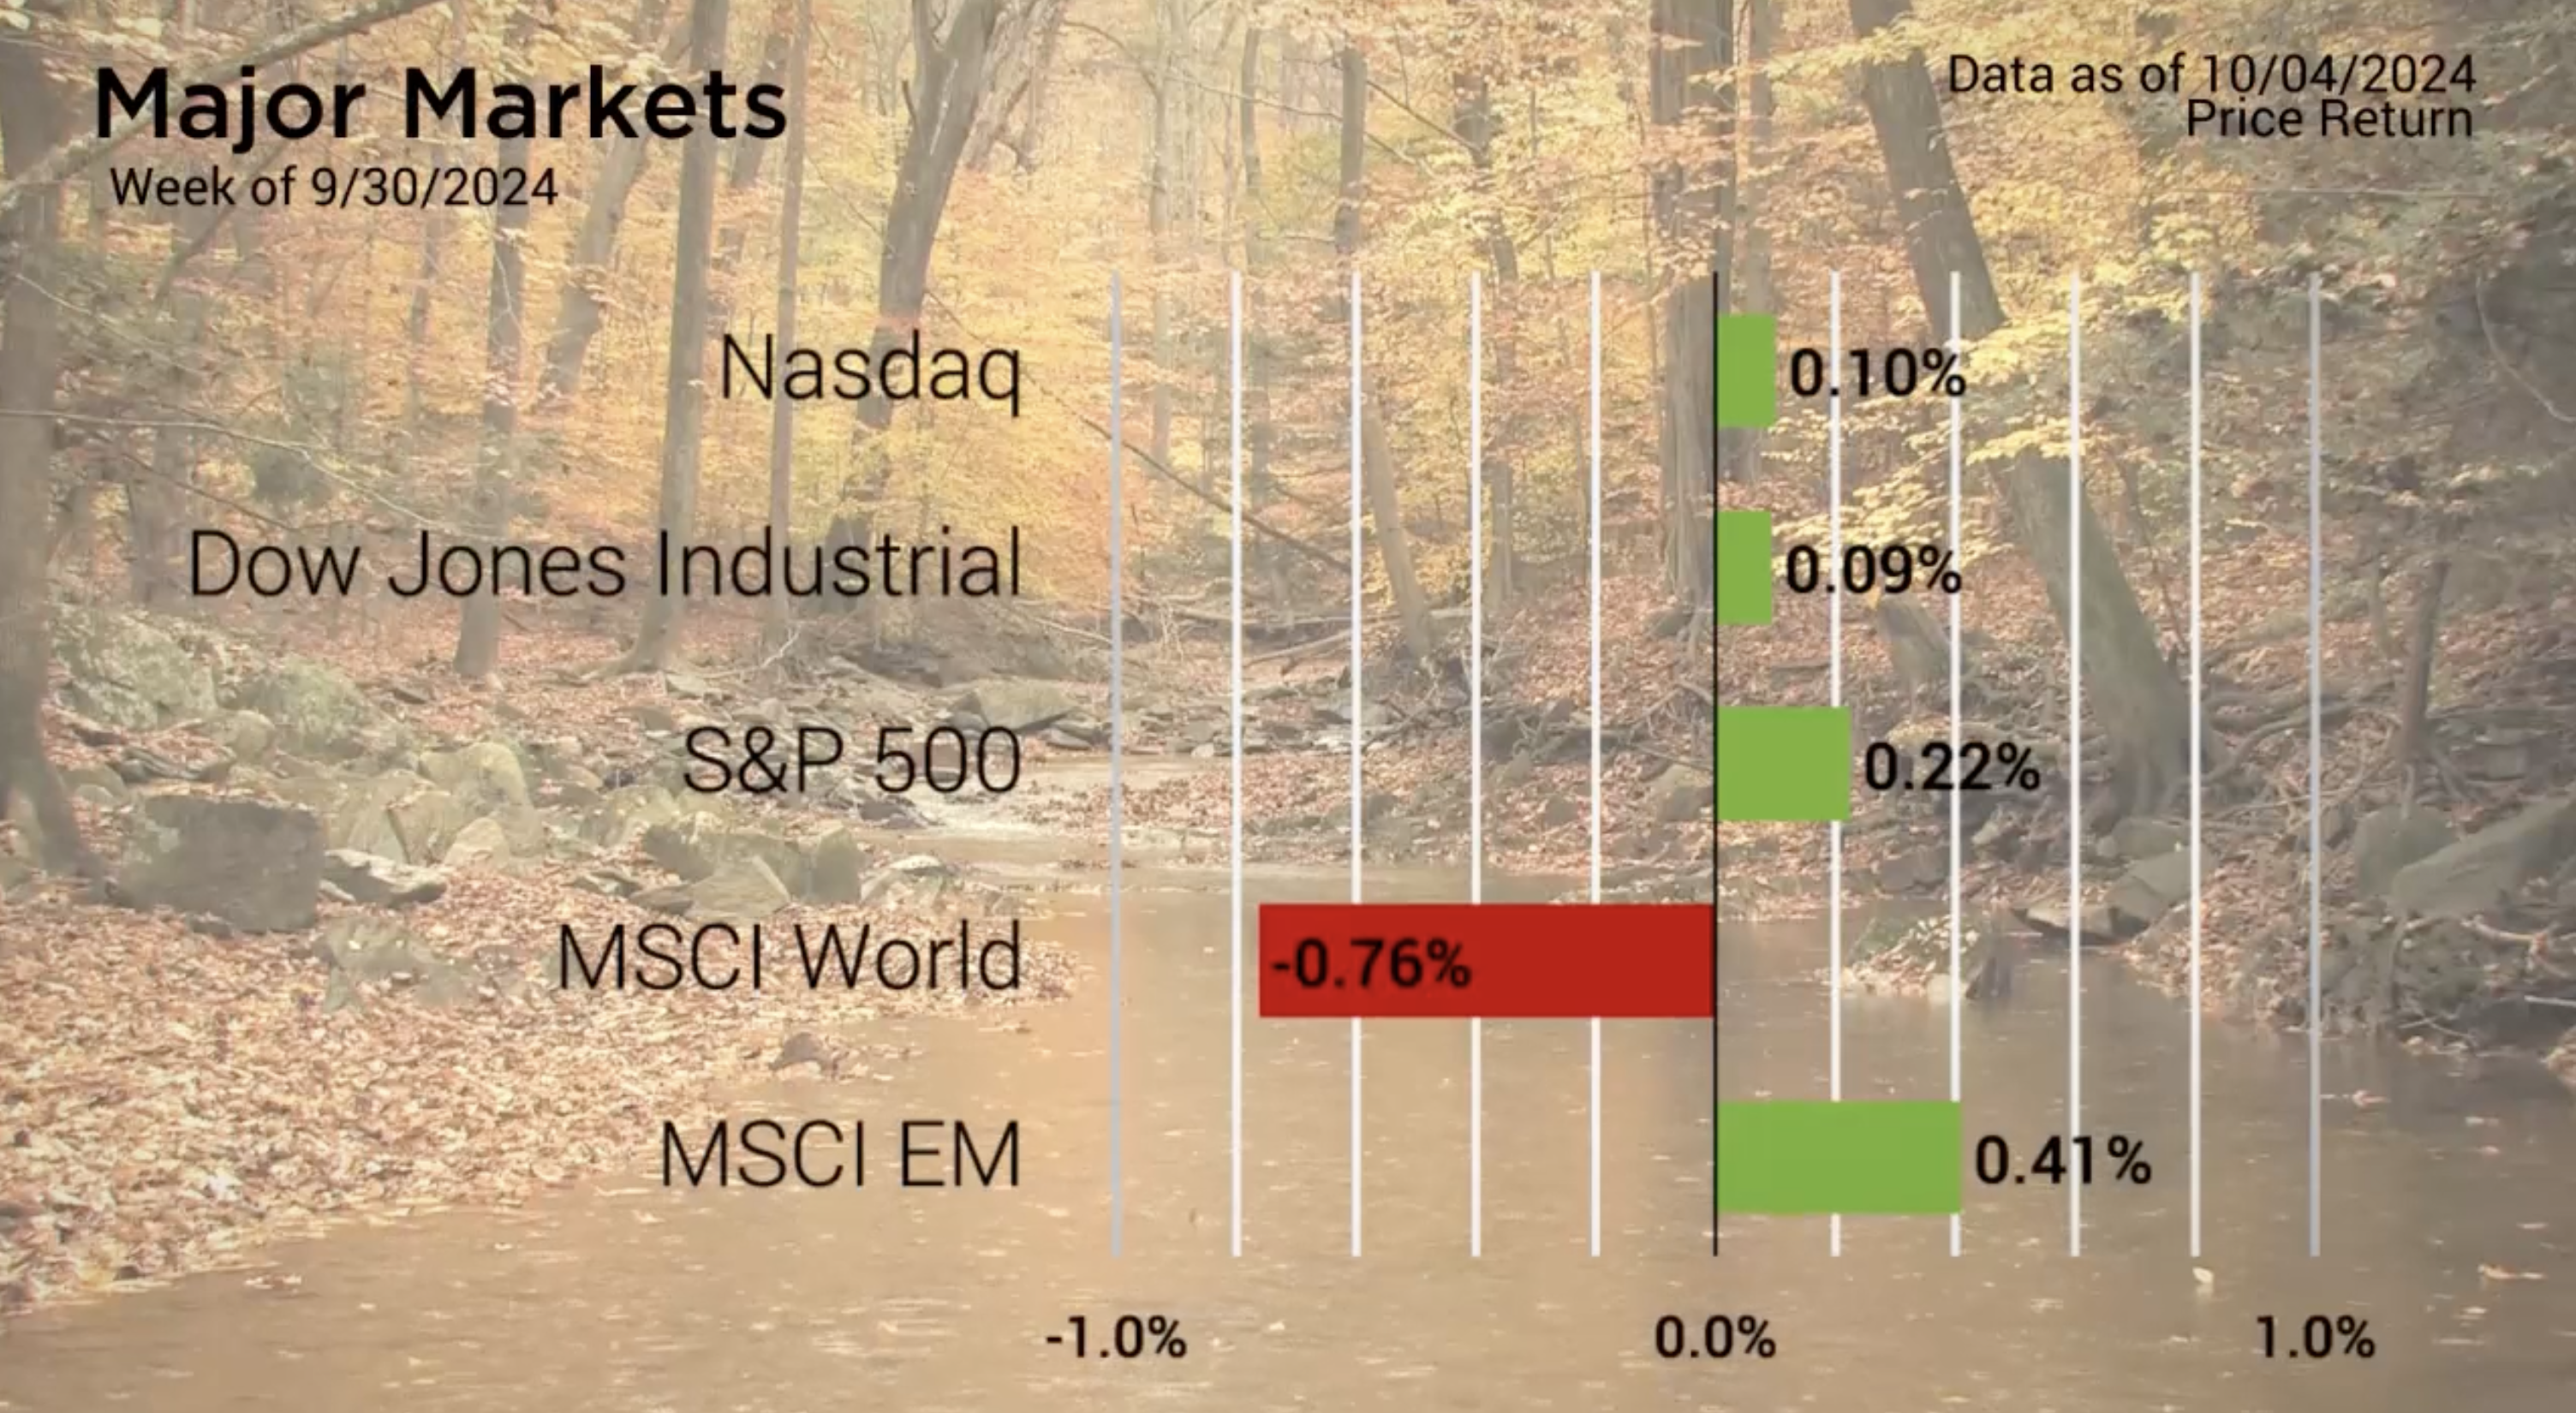
Major Markets Saw Mixed Activity Last Week
Posted on October 11, 2024
Major Markets Saw Mixed Activity Last Week
The Major Markets saw mixed activity last week. There were losses in the MSCI World Index while the other four indices closed slightly higher. This disparity in returns from the World Index and the greater domestic market is a bit of a rarity given that the World index has a weighting of over 70% in the United States.
Most of the rest of the developed countries that make up the World Index were not as fortunate as the domestic Market when geopolitical tensions escalated last week. The conflict in the middle east took focus when Iran launched a series of missiles against Israel. This had the result of sending commodity prices higher. Crude Oil WTI Futures had the unfortunate benefit of seeing prices jump from $68 a barrel the prior week to over $75 Friday. The GSCI Crude Oil Index shot up over nine percentage points higher in response.
In economic news, the September BLS Employment report blew out expectations with the headline reading of 254,000 new jobs compared to estimates of 150,000. Furthermore, the unemployment rate dropped to 4.1%. This same data set was criticized about a month ago due to the largest revision on record when the March data was revised lower by 818,000 jobs.

Major Markets |
YTD as of 10/04/2024 | ||
| Nasdaq |  |
||
| Dow Jones Industrial |  |
||
| S&P 500 |  |
||
| MSCI World |  |
||
| MSCI EM |  |
||
| Russell 2000 |  |
||
| Bar US Agg Bnd |  |
||
 |
|||
S&P Sectors |
|
|||||
| Comm. Services |  |
|||||
| Cons. Discretionary |  |
|||||
| Cons. Staples |  |
|||||
| Energy |  |
|||||
| Financials |  |
|||||
| Health Care |  |
|||||
| Industrials |  |
|||||
| Info. Technology |  |
|||||
| Materials |  |
|||||
| Real Estate |  |
|||||
| Utilities |  |
|||||
 |
||||||
| Agent/Broker Dealer Use Only | ||||||
Nevertheless, these results were strong enough to cause the probability of another 50-basis point cut to the Fed Funds rate at the November Meeting to drop to 0% according to the CME Group’s Fed Watch tool on Friday. Interest Rates rose sharply in response. The 2-year yield rose the most as the duration added 38 basis points week-over-week.
Bond indices fell across the board. The Bloomberg Barclays Aggregate Bond Index fell around 1.25% by the end of the week.
https://www.bbc.com/news/articles/c70w1j0l488o
https://www.cnn.com/2024/08/21/economy/bls-jobs-revisions/index.html
Concerned about inflation? Check out our Tips to Reduce Risks In Case of Recession.
| The S&P 500® Index is a capitalization index of 500 stock-designed to measure performance of the broad domestic economy through changes in the aggregate market value of stock representing all major industries. https://us.spindices.com/indices/equity/sp-500 The Dow Jones Industrial Average® (The Dow®), is a price-weighted measure of 30 U.S. blue-chip companies. The index covers all industries except transportation and utilities. https://us.spindices.com/indices/equity/dow-jones-industrial-average The NASDAQ Composite Index measures all NASDAQ domestic and international based common type stocks listed on The NASDAQ Stock Market. Today the NASDAQ Composite includes over 2,500 companies, more than most other stock market indexes. Because it is so broad-based, the Composite is one of the most widely followed and quoted major market indexes. https://indexes.nasdaqomx.com/Index/Overview/COMP The MSCI World Index, which is part of The Modern Index Strategy, is a broad global equity benchmark that represents large and mid-cap equity performance across 23 developed markets countries. It covers approximately 85% of the free float-adjusted market capitalization in each country and MSCI World benchmark does not offer exposure to emerging markets. The MSCI Emerging Markets (EM) Index is designed to represent the performance of large- and mid-cap securities in 24 Emerging Markets countries of the Americas, Europe, the Middle East, Africa and Asia. As of December 2017, it had more than 830 constituents and covered approximately 85% of the free float-adjusted market capitalization in each country. https://www.msci.com/ The S&P GSCI Crude Oil index provides investors with a reliable and publicly available benchmark for investment performance in the crude oil market. https://us.spindices.com/indices Companies in the S&P 500 Sector Indices are classified based on the Global Industry Classification Standard (GICS®). https://us.spindices.com/indices |


