


 Our Leadership Team
 Find An Advisor
 Our Platform
 Advisory
 Alternatives
 Insurance
 Specialized Services
 Individual Investors
 Retirees
 Business Owners
 Family Offices & Institutions
 Doctors
 Tenants
 Accountants
Weekly Market Commentary
Major Markets Saw Positive Performance
Posted on October 15, 2024
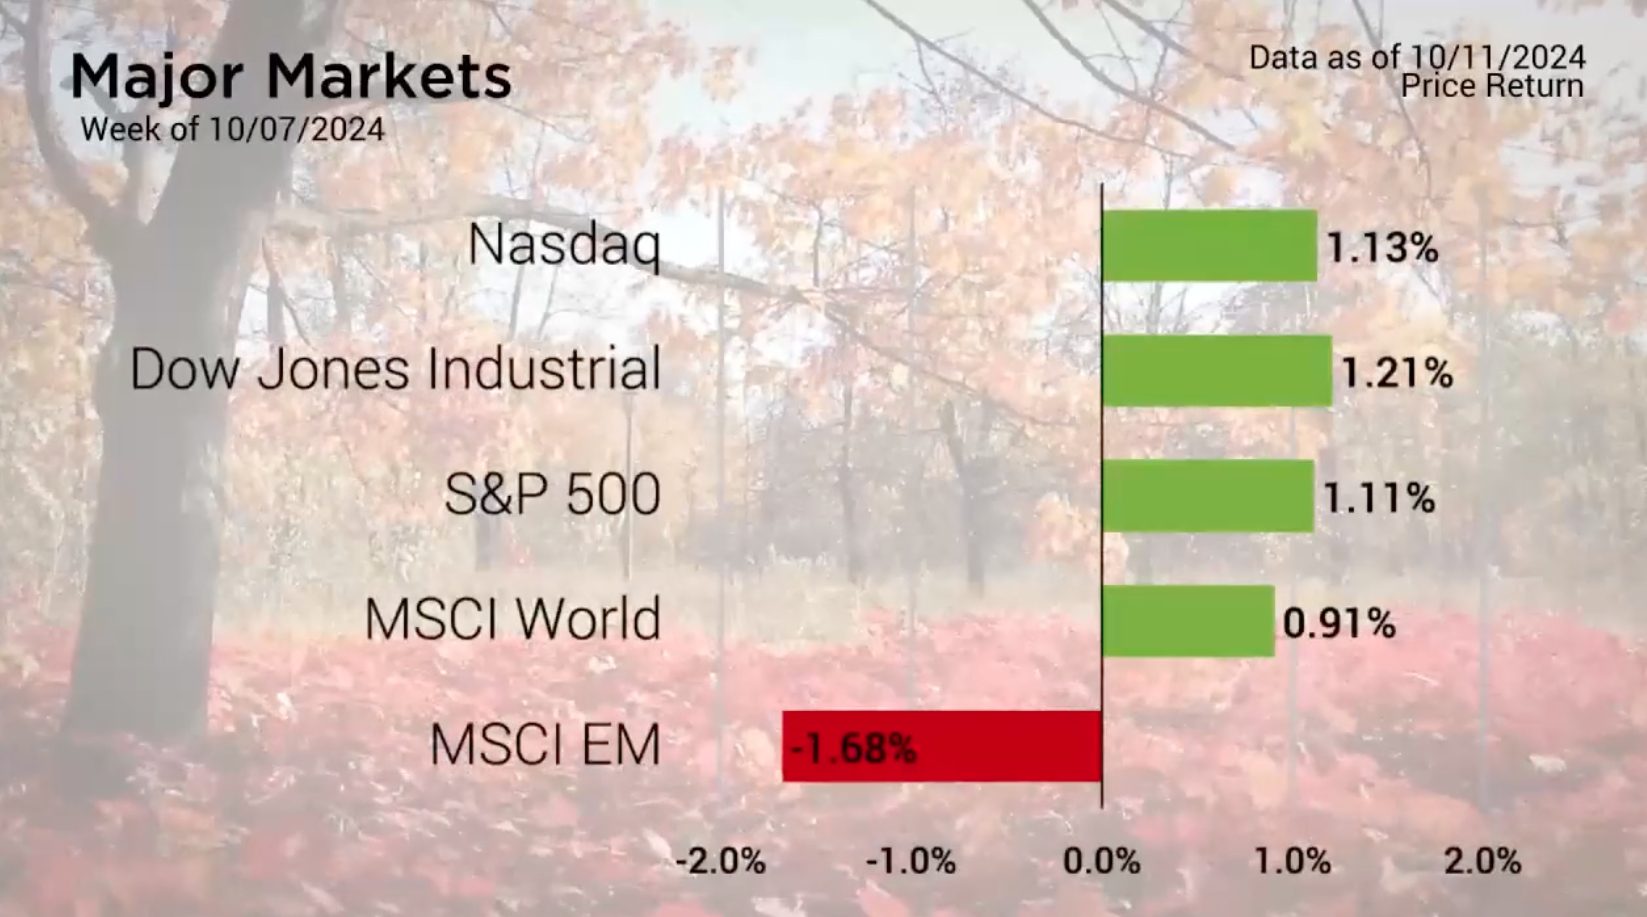
Major Markets Saw Positive Performance
The major markets saw positive performance in four of the five indices last week. Emerging Markets suffered in large part due to a pullback in China as the MSCI China Index lost seven percent last week. This drop was on the back of a recent runup that China experienced a couple weeks ago following an announced platform of stimulus and overall financial ease. When market participants and analysts felt that the Chinese government had not given enough clarity and guidance around said announcement, the market took a more bearish posture.
But for the domestic market, the S&P 500 and the Dow Jones Average both managed to log new all-time highs. At the sector level, six of the eleven sectors closed higher with notable gains in a number of them.
Major Markets |
YTD as of 10/11/2024 | ||
| Nasdaq |  |
||
| Dow Jones Industrial |  |
||
| S&P 500 |  |
||
| MSCI World |  |
||
| MSCI EM |  |
||
| Russell 2000 |  |
||
| Bar US Agg Bnd |  |
||
 |
|||
S&P Sectors |
|
|||||
| Comm. Services |  |
|||||
| Cons. Discretionary |  |
|||||
| Cons. Staples |  |
|||||
| Energy |  |
|||||
| Financials |  |
|||||
| Health Care |  |
|||||
| Industrials |  |
|||||
| Info. Technology |  |
|||||
| Materials |  |
|||||
| Real Estate |  |
|||||
| Utilities |  |
|||||
 |
||||||
| Agent/Broker Dealer Use Only | ||||||
Meanwhile, the economic calendar saw the release of higher-than-expected Consumer Price Index results. The headline reading of 0.2% exceeded monthly estimates of 0.1% by just as much. This tempered further aggressive Fed Funds rate cut expectations. However, Friday’s Producer Price Index headline reading came in below estimates with an effectively flat reading. These inflationary readings did little to change the upcoming meeting expectations for interest rates according to the CME Group’s Fed Watch tool.
As of Friday, the greatest likelihood of the Fed Funds rate is to see additional incremental 25 basis point cuts at the next few meetings.
In the end, the longer end of the yield curve rose slightly, applying downward pressure on the bond market.
Concerned about inflation? Check out our Tips to Reduce Risks In Case of Recession.
| The S&P 500® Index is a capitalization index of 500 stock-designed to measure performance of the broad domestic economy through changes in the aggregate market value of stock representing all major industries. https://us.spindices.com/indices/equity/sp-500 The Dow Jones Industrial Average® (The Dow®), is a price-weighted measure of 30 U.S. blue-chip companies. The index covers all industries except transportation and utilities. https://us.spindices.com/indices/equity/dow-jones-industrial-average The NASDAQ Composite Index measures all NASDAQ domestic and international based common type stocks listed on The NASDAQ Stock Market. Today the NASDAQ Composite includes over 2,500 companies, more than most other stock market indexes. Because it is so broad-based, the Composite is one of the most widely followed and quoted major market indexes. https://indexes.nasdaqomx.com/Index/Overview/COMP The MSCI World Index, which is part of The Modern Index Strategy, is a broad global equity benchmark that represents large and mid-cap equity performance across 23 developed markets countries. It covers approximately 85% of the free float-adjusted market capitalization in each country and MSCI World benchmark does not offer exposure to emerging markets. The MSCI Emerging Markets (EM) Index is designed to represent the performance of large- and mid-cap securities in 24 Emerging Markets countries of the Americas, Europe, the Middle East, Africa and Asia. As of December 2017, it had more than 830 constituents and covered approximately 85% of the free float-adjusted market capitalization in each country. https://www.msci.com/ The S&P GSCI Crude Oil index provides investors with a reliable and publicly available benchmark for investment performance in the crude oil market. https://us.spindices.com/indices Companies in the S&P 500 Sector Indices are classified based on the Global Industry Classification Standard (GICS®). https://us.spindices.com/indices |


