


 Our Leadership Team
 Find An Advisor
 Our Platform
 Advisory
 Alternatives
 Insurance
 Specialized Services
 Individual Investors
 Retirees
 Business Owners
 Family Offices & Institutions
 Doctors
 Tenants
 Accountants
Weekly Market Commentary
Market Decline and Political Changes Shake Wall Street
Posted on July 23, 2024
It was a rough week for the markets as four out of the five indices closed lower. The Dow was the lone index in positive territory of these five as the rest of the major indices closed deeply lower for the week.
The Nasdaq fell the hardest as a number of headlines hit the streets questioning if an AI bubble was in the process of bursting. A number of companies that have taken significant positions towards embracing AI fell last week with losses in Google Alphabet, Microsoft, and especially Nvidia.
The Sectors highlighted this drop in sentiment, at least temporarily, with a five-percentage point pullback in IT and another nearly 3 percentage points in Communication Services.
That said, not all was lost last week. Breaking the domestic market down by style boxes, we see that just like in recent weeks, the S&P 500 is not the full story of the domestic market. Large Cap Growth fared even worse than the mainstay blue chip index, but the value and small cap segments performed much differently. Small Cap Value performed the best last week, adding 2.68%. This was enough to bring the index back into positive territory for the year, making the full 9 boxes green.
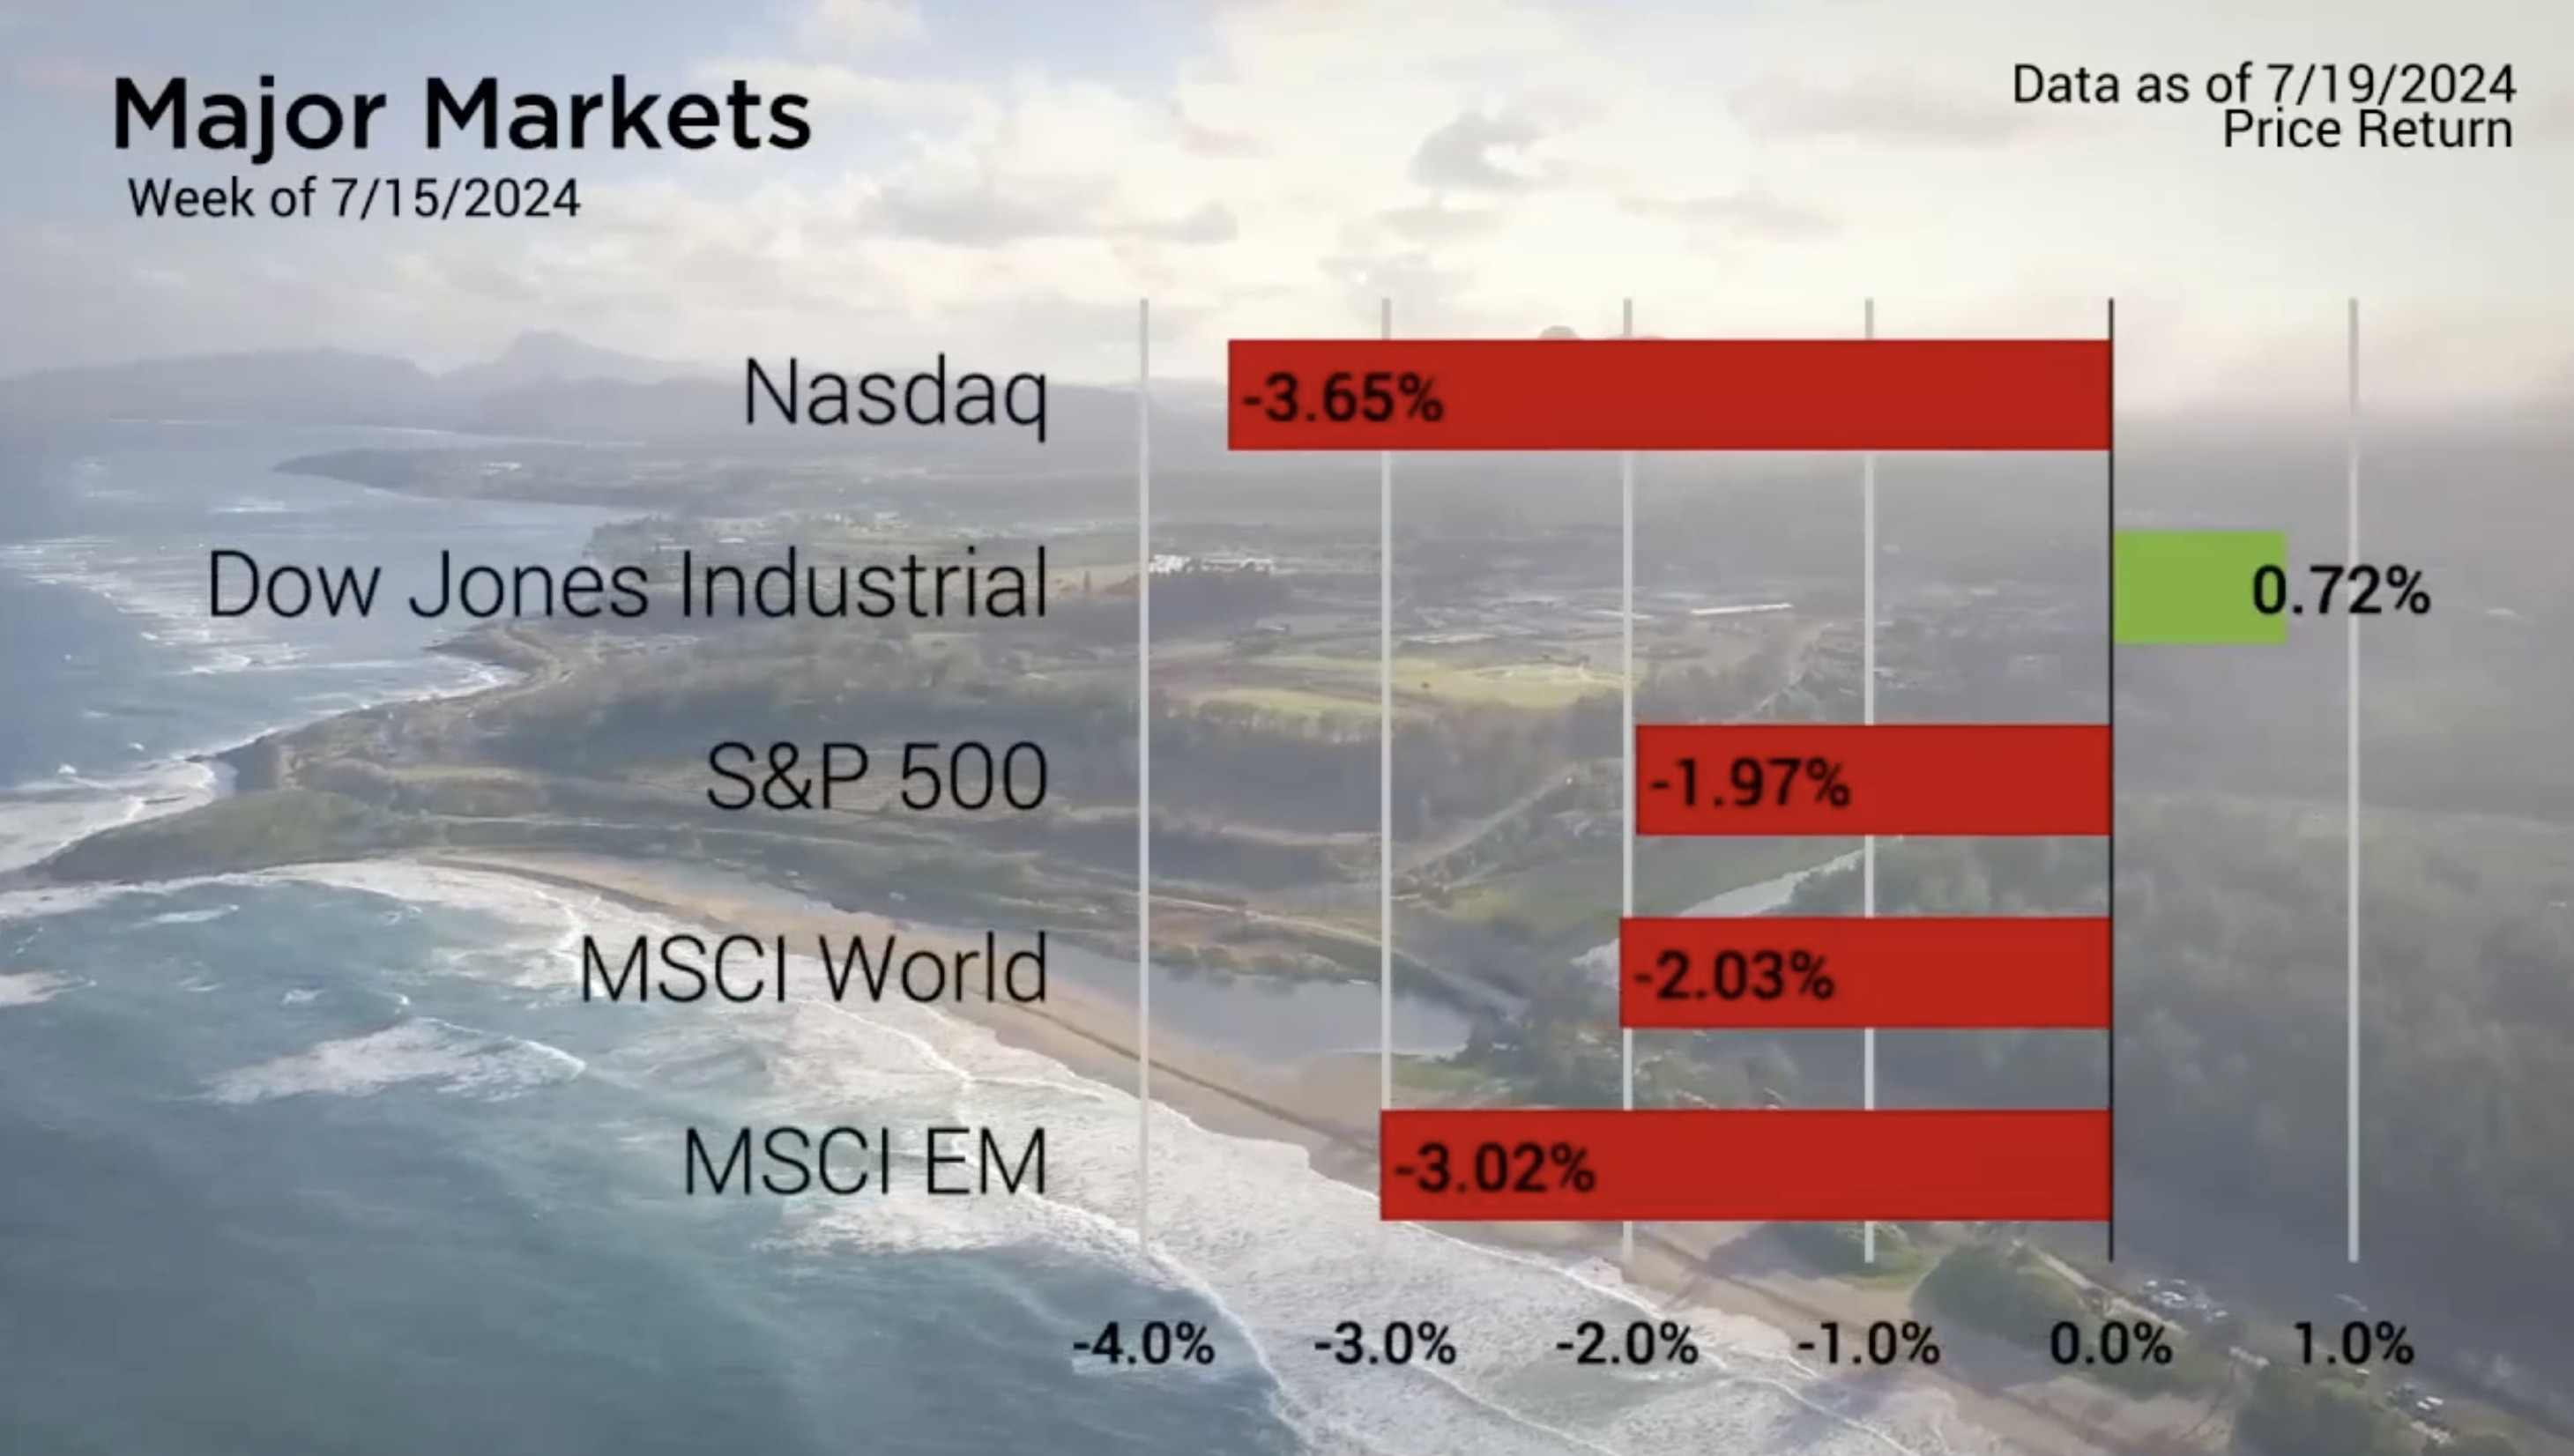
Major Markets |
YTD as of 7/19/2024 | ||
| Nasdaq |  |
||
| Dow Jones Industrial |  |
||
| S&P 500 |  |
||
| MSCI World |  |
||
| MSCI EM |  |
||
| Russell 2000 |  |
||
| Bar US Agg Bnd |  |
||
 |
|||
S&P Sectors |
|
|||||
| Comm. Services |  |
|||||
| Cons. Discretionary |  |
|||||
| Cons. Staples |  |
|||||
| Energy |  |
|||||
| Financials |  |
|||||
| Health Care |  |
|||||
| Industrials |  |
|||||
| Info. Technology |  |
|||||
| Materials |  |
|||||
| Real Estate |  |
|||||
| Utilities |  |
|||||
 |
||||||
| Agent/Broker Dealer Use Only | ||||||
In other news, politics really began to move into focus as the news was filled with the iconic photo of former president Trump immediately after the prior weekend’s assassination attempt. This was combined with the RNC’s convention and announcement of a new running mate in J. D. Vance. The week was bookended with the rumors of President Biden dropping out of the Presidential Race. This became reality Sunday with an announcement from President Biden. Vice President Kamala Harris moving into top nomination position ahead of the August 19th DNC Convention in Chicago.
These events will cause market participants to reprice what either of these two administrations might mean for the stock market as more information is known.
Interest Rates remained relatively unchanged week-over-week, despite the equity market rotation. Meanwhile, the CME Group’s FedWatch Tool continued to lean into the probability of an initial rate-cut as the September meeting, which now reflects a 91.7% probability. Meanwhile, the possibility of an additional rate cut in November became more of a coin toss chance while odds increased that December would close out the year between 475 and 500 basis points.
Concerned about inflation? Check out our Tips to Reduce Risks In Case of Recession.
| The S&P 500® Index is a capitalization index of 500 stock-designed to measure performance of the broad domestic economy through changes in the aggregate market value of stock representing all major industries. https://us.spindices.com/indices/equity/sp-500 The Dow Jones Industrial Average® (The Dow®), is a price-weighted measure of 30 U.S. blue-chip companies. The index covers all industries except transportation and utilities. https://us.spindices.com/indices/equity/dow-jones-industrial-average The NASDAQ Composite Index measures all NASDAQ domestic and international based common type stocks listed on The NASDAQ Stock Market. Today the NASDAQ Composite includes over 2,500 companies, more than most other stock market indexes. Because it is so broad-based, the Composite is one of the most widely followed and quoted major market indexes. https://indexes.nasdaqomx.com/Index/Overview/COMP The MSCI World Index, which is part of The Modern Index Strategy, is a broad global equity benchmark that represents large and mid-cap equity performance across 23 developed markets countries. It covers approximately 85% of the free float-adjusted market capitalization in each country and MSCI World benchmark does not offer exposure to emerging markets. The MSCI Emerging Markets (EM) Index is designed to represent the performance of large- and mid-cap securities in 24 Emerging Markets countries of the Americas, Europe, the Middle East, Africa and Asia. As of December 2017, it had more than 830 constituents and covered approximately 85% of the free float-adjusted market capitalization in each country. https://www.msci.com/ The S&P GSCI Crude Oil index provides investors with a reliable and publicly available benchmark for investment performance in the crude oil market. https://us.spindices.com/indices Companies in the S&P 500 Sector Indices are classified based on the Global Industry Classification Standard (GICS®). https://us.spindices.com/indices |


