


 Our Leadership Team
 Find An Advisor
 Our Platform
 Advisory
 Alternatives
 Insurance
 Specialized Services
 Individual Investors
 Retirees
 Business Owners
 Family Offices & Institutions
 Doctors
 Tenants
 Accountants
Weekly Market Commentary
Market Rally Masks Underlying Imbalances
Posted on June 11, 2024
It was green across the board last week as all five indices logged gains. This was a welcome reversal from the prior week which saw all five indices close lower. These gains took both the S&P 500 and the Nasdaq to fresh all-time highs.
But as nice as these gains were for the five major market indices, there was an imbalance across the style boxes. Large Cap Value didn’t even manage to close positive and the entirety of the mid-cap and small cap segments ended with losses exceeding two percentage points for the S&P indices.
Weeks like last week highlight how there can be a significant difference in performance when digging beyond the headline numbers.
At the sector level, we see that the winners and losers were fairly evenly spread out across the sectors with five ending positive and six ending lower. However, the greatest gains were in Information Technology followed by Health Care, Communication Service and Consumer Discretionary.
Major Markets |
YTD as of 6/07/2024 | ||
| Nasdaq |  |
||
| Dow Jones Industrial |  |
||
| S&P 500 |  |
||
| MSCI World |  |
||
| MSCI EM |  |
||
| Russell 2000 |  |
||
| Bar US Agg Bnd |  |
||
 |
|||
S&P Sectors |
|
|||||
| Comm. Services |  |
|||||
| Cons. Discretionary |  |
|||||
| Cons. Staples |  |
|||||
| Energy |  |
|||||
| Financials |  |
|||||
| Health Care |  |
|||||
| Industrials |  |
|||||
| Info. Technology |  |
|||||
| Materials |  |
|||||
| Real Estate |  |
|||||
| Utilities |  |
|||||
 |
||||||
| Agent/Broker Dealer Use Only | ||||||
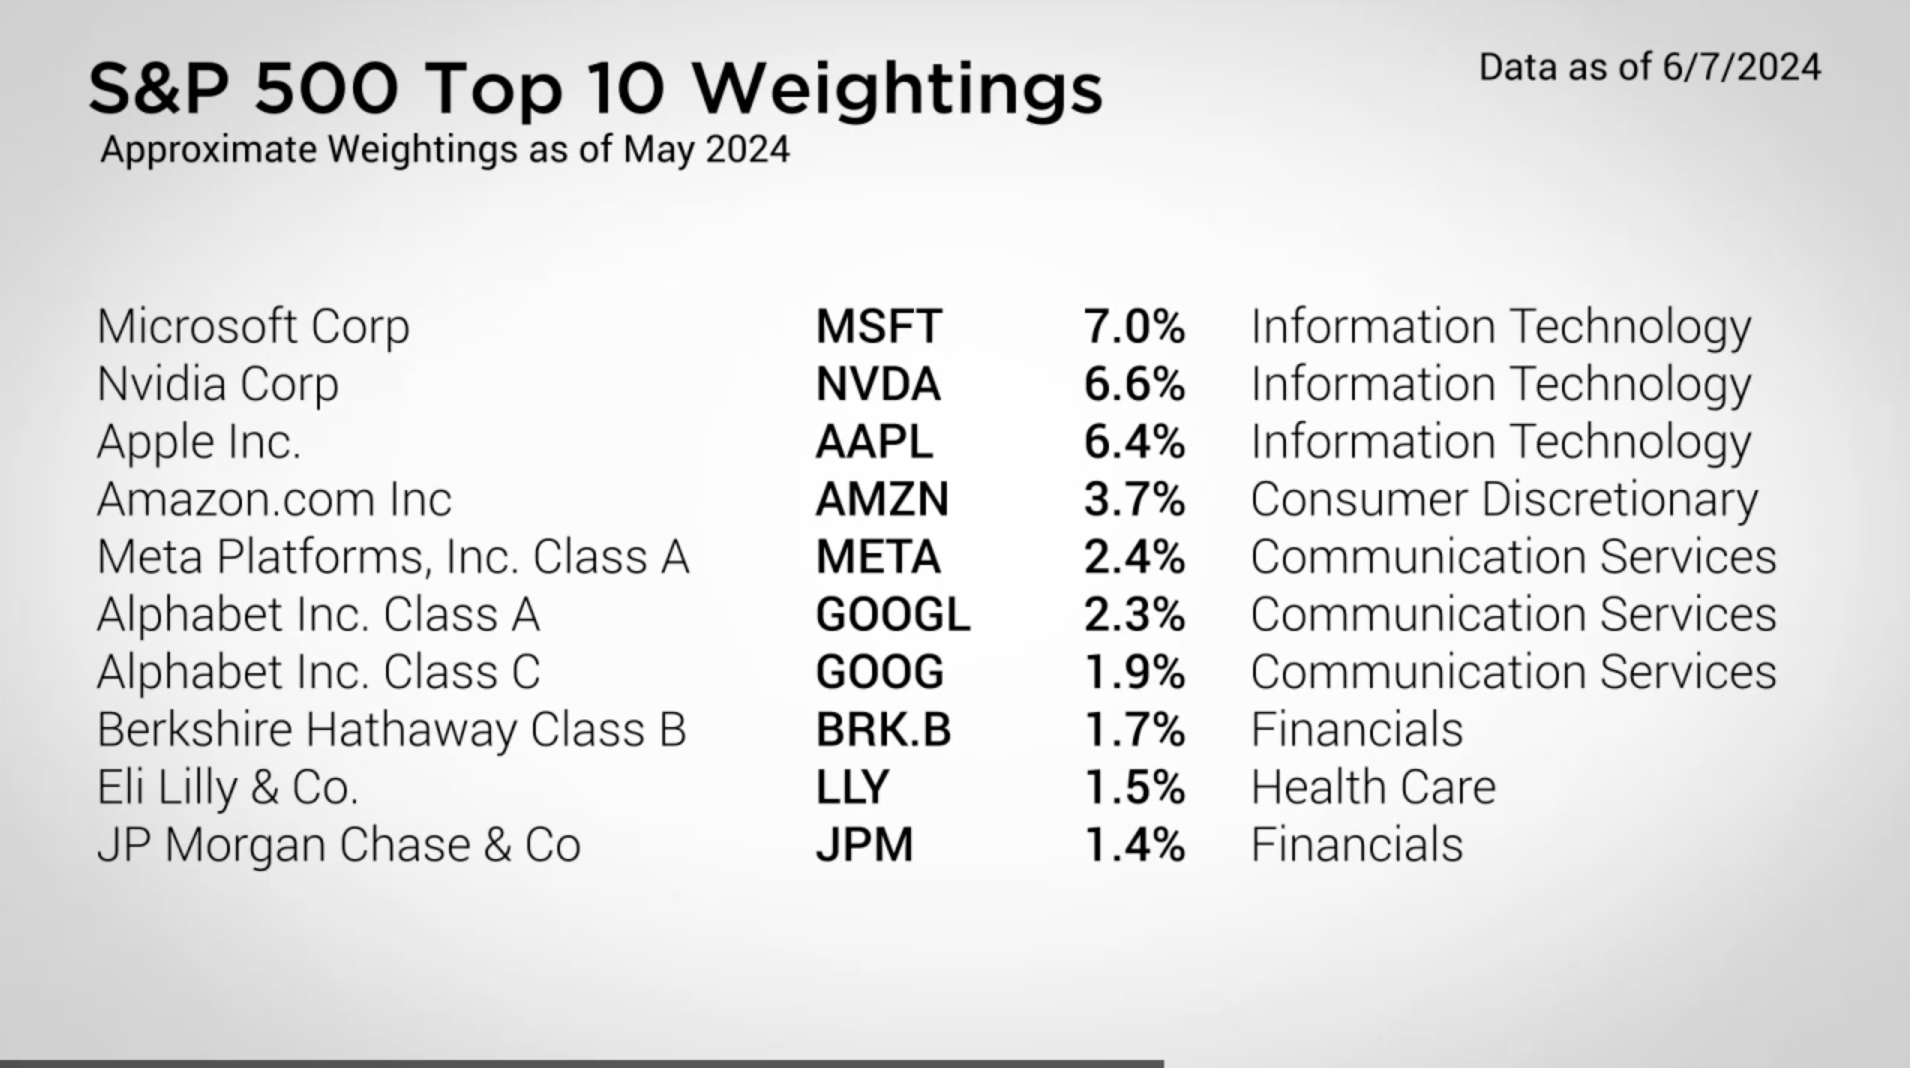
The weightings of the Information Technology and Consumer Discretionary sectors are heavier in the Nasdaq than the S&P 500 which can often result in a performance imbalance as a number of these companies like NVDIA have made the news for their rampant growth.
Moreover, the top 10 companies of the S&P 500 account for roughly 35% of the overall S&P 500 Index. Seven of the top ten holdings occupy segments that are heavily tech centric. Understanding these dynamics helps to understand why there can be significant difference in personal performance when diversifying across greater areas of the investable market.
On the economic front, Friday saw the release of the May BLS Employment Report. Much like the domestic market, the headline number was a welcome read; 272,000 jobs were added, eclipsing the expectations of 190,000.
However, the unemployment rate actually rose from 3.9% to 4.0%. Furthermore, the household survey showed a reduction of 408,000 jobs last month. Much like last week’s divergence in market performance, May’s employment report demonstrated that economic reports can tell two different stories when digging a little deeper.
https://www.spglobal.com/spdji/en/indices/equity/sp-500/#data
https://indexes.nasdaqomx.com/Index/Breakdown/COMP
Concerned about inflation? Check out our Tips to Reduce Risks In Case of Recession.
| The S&P 500® Index is a capitalization index of 500 stock-designed to measure performance of the broad domestic economy through changes in the aggregate market value of stock representing all major industries. https://us.spindices.com/indices/equity/sp-500 The Dow Jones Industrial Average® (The Dow®), is a price-weighted measure of 30 U.S. blue-chip companies. The index covers all industries except transportation and utilities. https://us.spindices.com/indices/equity/dow-jones-industrial-average The NASDAQ Composite Index measures all NASDAQ domestic and international based common type stocks listed on The NASDAQ Stock Market. Today the NASDAQ Composite includes over 2,500 companies, more than most other stock market indexes. Because it is so broad-based, the Composite is one of the most widely followed and quoted major market indexes. https://indexes.nasdaqomx.com/Index/Overview/COMP The MSCI World Index, which is part of The Modern Index Strategy, is a broad global equity benchmark that represents large and mid-cap equity performance across 23 developed markets countries. It covers approximately 85% of the free float-adjusted market capitalization in each country and MSCI World benchmark does not offer exposure to emerging markets. The MSCI Emerging Markets (EM) Index is designed to represent the performance of large- and mid-cap securities in 24 Emerging Markets countries of the Americas, Europe, the Middle East, Africa and Asia. As of December 2017, it had more than 830 constituents and covered approximately 85% of the free float-adjusted market capitalization in each country. https://www.msci.com/ The S&P GSCI Crude Oil index provides investors with a reliable and publicly available benchmark for investment performance in the crude oil market. https://us.spindices.com/indices Companies in the S&P 500 Sector Indices are classified based on the Global Industry Classification Standard (GICS®). https://us.spindices.com/indices |


