Weekly Market Commentary
Markets Rally After Trump Victory
Posted on November 15, 2024
Markets Rally After Trump Victory
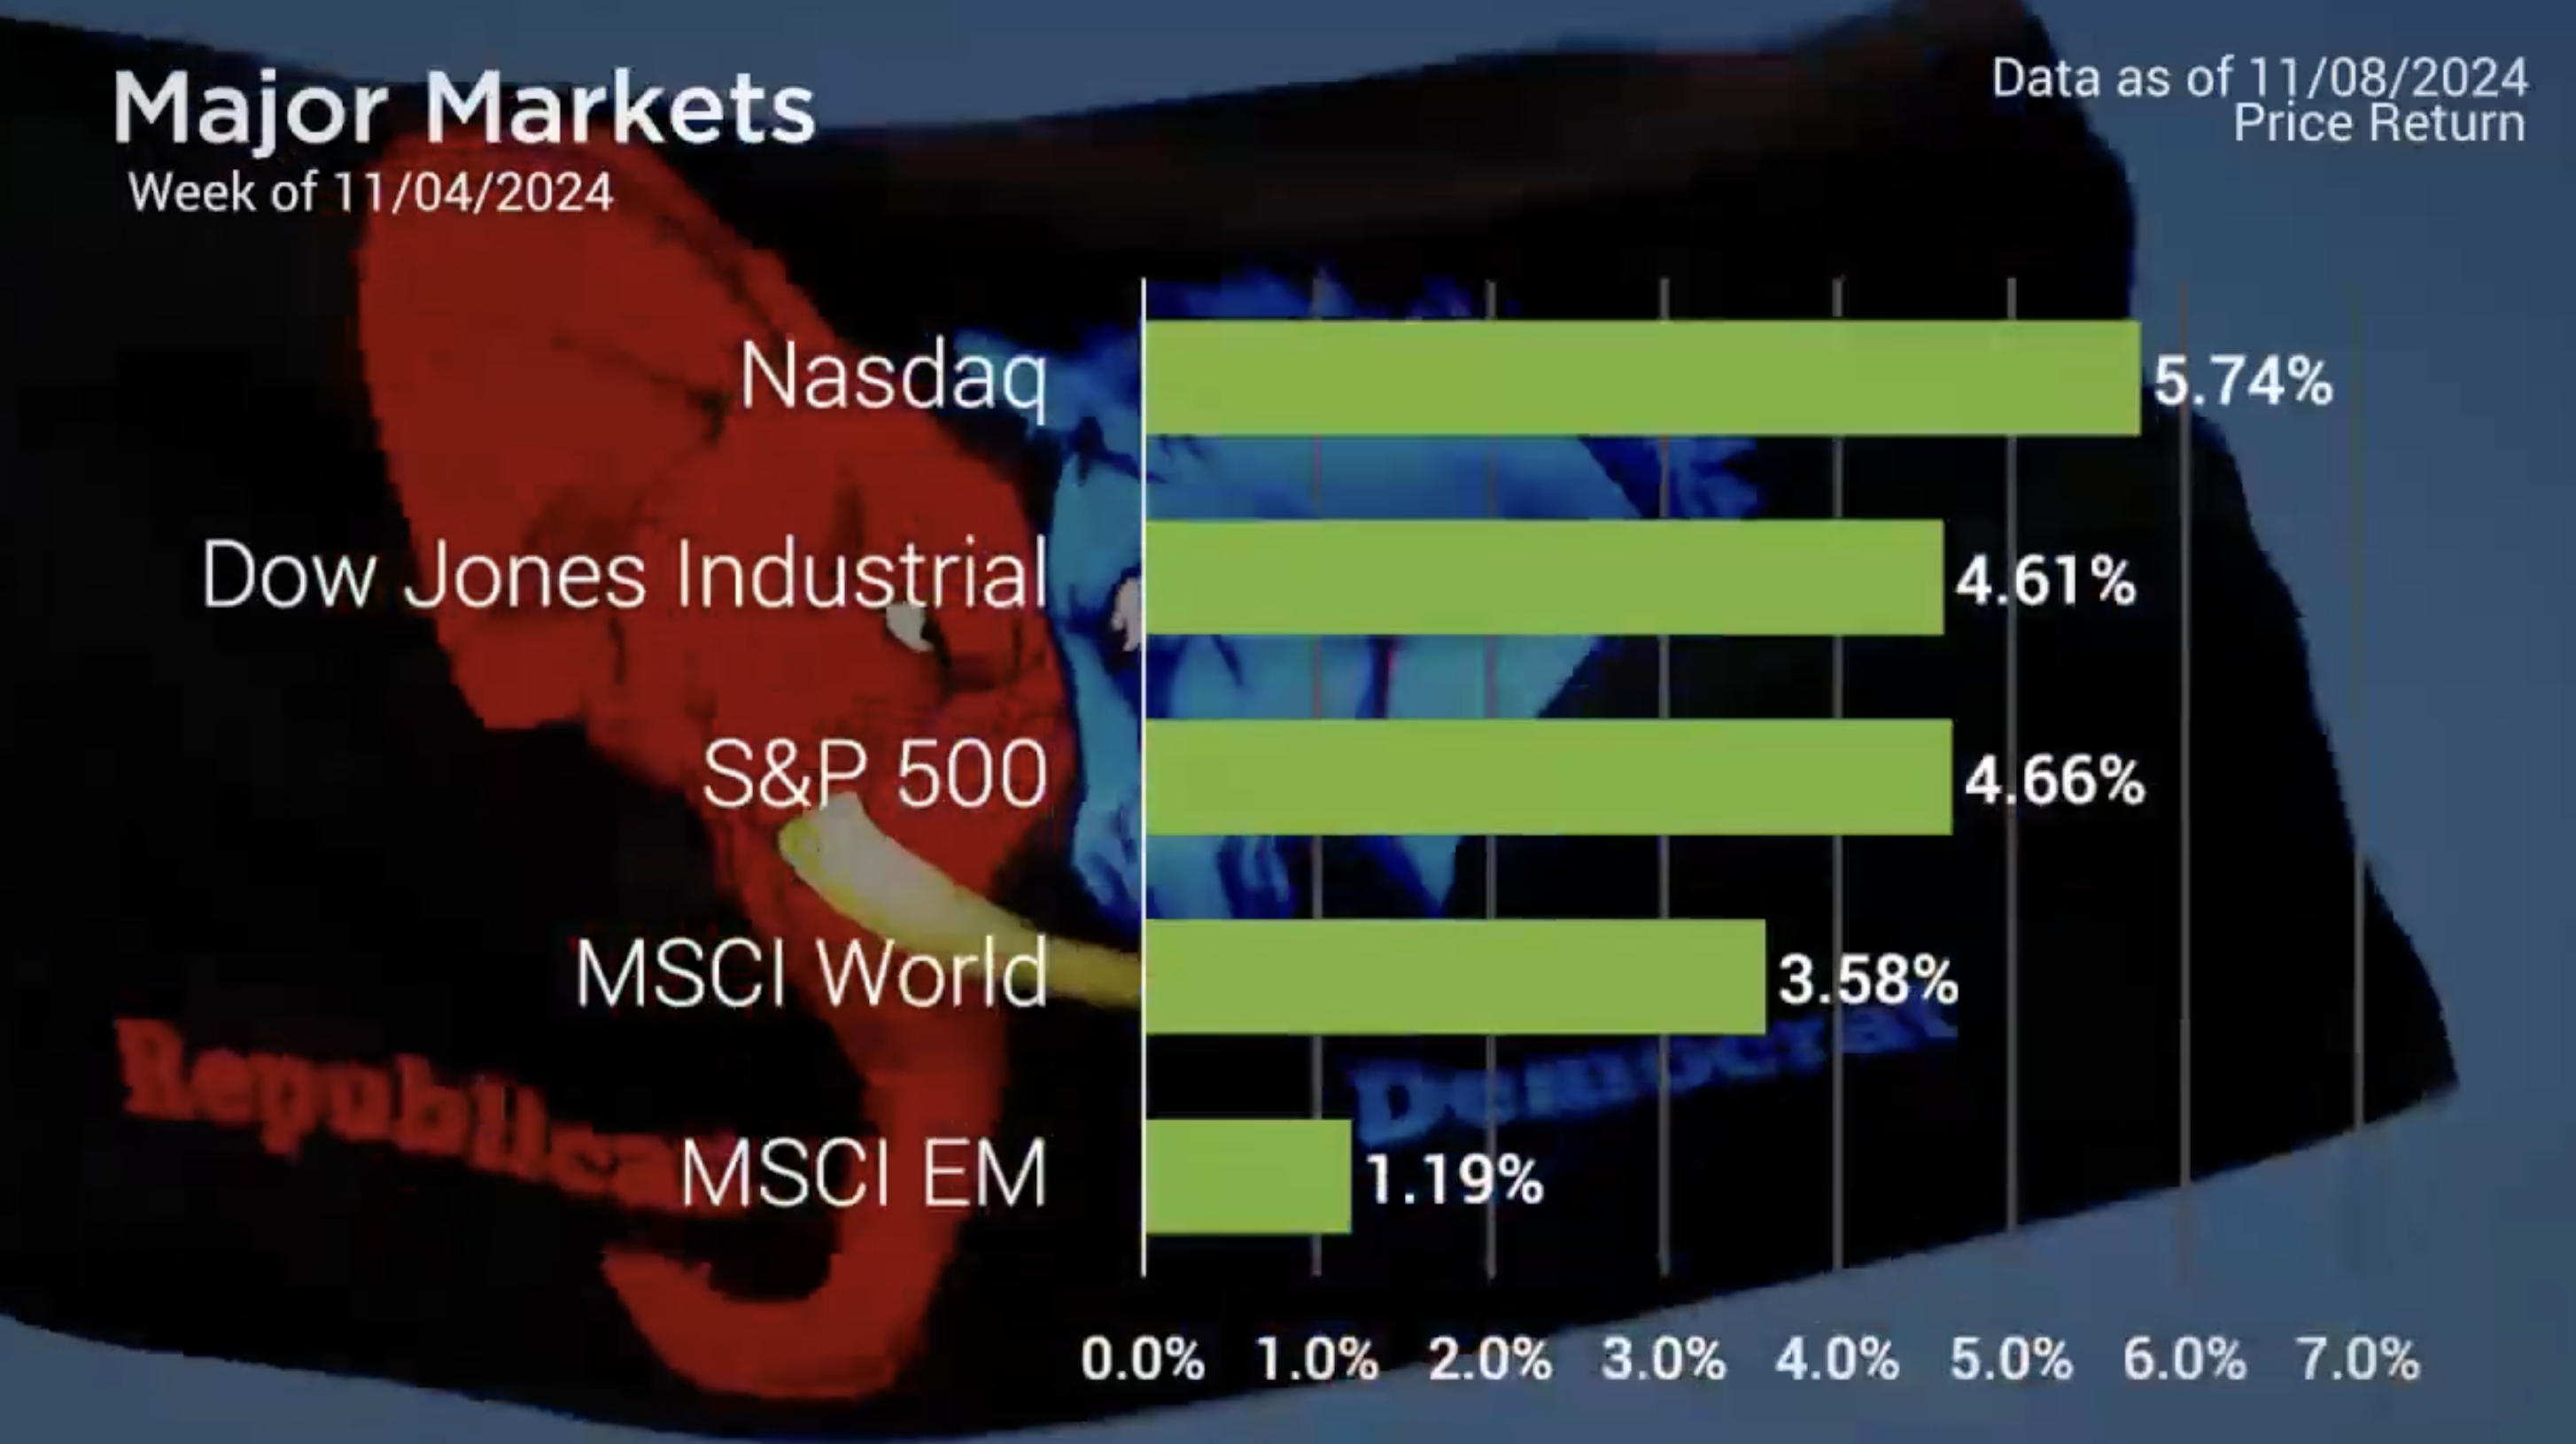
While last week was dominated by election news about red states and blue states, the markets were awash in green. The major Markets saw gains across the board with the greatest gains in the Nasdaq followed by the S&P 500. Without a doubt, the biggest headline event last week was the news that Donald J Trump won the presidential election, securing 312 electoral votes. This makes him the first and only president since Grover Cleveland to be set to serve two nonconsecutive terms as President.
The day after the election saw the best post-election day performance of the S&P 500 with an impressive gain of 2.5% . It’s difficult to directly tie a signal event, especially around politics, to the performance of the stock market. That said, the gain of 2.5% Wednesday was only slightly better than 2020’s post-election day performance.
Tesla was one standout performer last week as the company rose 14.75% the day after the election and logged a weekly gain of 29% percent. This optimism was fueled by the idea that Elon Musk’s strong support of the President Elect would be a boost for the company as well, with Trump having secured the presidency.
Tesla’s surge in performance was a significant contributor to the 7.62% weekly gain in the Consumer Discretionary sector. However, the gains in the Stock market were also widespread as every sector closed higher with the smallest gains in Utilities at 1.19%.
Small and Mid-cap stocks fared even better with gains as high as 8.6% in the Small Cap 600 Growth index.

Major Markets |
YTD as of 11/08/2024 | ||
| Nasdaq |  |
||
| Dow Jones Industrial |  |
||
| S&P 500 |  |
||
| MSCI World |  |
||
| MSCI EM |  |
||
| Russell 2000 |  |
||
| Bar US Agg Bnd |  |
||
 |
|||
S&P Sectors |
|
|||||
| Comm. Services |  |
|||||
| Cons. Discretionary |  |
|||||
| Cons. Staples |  |
|||||
| Energy |  |
|||||
| Financials |  |
|||||
| Health Care |  |
|||||
| Industrials |  |
|||||
| Info. Technology |  |
|||||
| Materials |  |
|||||
| Real Estate |  |
|||||
| Utilities |  |
|||||
 |
||||||
| Agent/Broker Dealer Use Only | ||||||
Flying somewhat under the radar last week due to the political developments was the FOMC Meeting midweek. This meeting saw a 25% basis point cut to the Fed Funds rate, which was widely expected. Presently, the odds of another 25-basis point cut in December remains the highest probability. Yet, the odds for additional cuts to the Fed Funds Rate have fallen as of late. The CME Group’s Fed Watch Tool has the market anticipating rate cuts stalling out at 4 percent level with only a roughly 60% chance that rates will be at or below this level at the end of 2025.
Concerned about inflation? Check out our Tips to Reduce Risks In Case of Recession.
| The S&P 500® Index is a capitalization index of 500 stock-designed to measure performance of the broad domestic economy through changes in the aggregate market value of stock representing all major industries. https://us.spindices.com/indices/equity/sp-500 The Dow Jones Industrial Average® (The Dow®), is a price-weighted measure of 30 U.S. blue-chip companies. The index covers all industries except transportation and utilities. https://us.spindices.com/indices/equity/dow-jones-industrial-average The NASDAQ Composite Index measures all NASDAQ domestic and international based common type stocks listed on The NASDAQ Stock Market. Today the NASDAQ Composite includes over 2,500 companies, more than most other stock market indexes. Because it is so broad-based, the Composite is one of the most widely followed and quoted major market indexes. https://indexes.nasdaqomx.com/Index/Overview/COMP The MSCI World Index, which is part of The Modern Index Strategy, is a broad global equity benchmark that represents large and mid-cap equity performance across 23 developed markets countries. It covers approximately 85% of the free float-adjusted market capitalization in each country and MSCI World benchmark does not offer exposure to emerging markets. The MSCI Emerging Markets (EM) Index is designed to represent the performance of large- and mid-cap securities in 24 Emerging Markets countries of the Americas, Europe, the Middle East, Africa and Asia. As of December 2017, it had more than 830 constituents and covered approximately 85% of the free float-adjusted market capitalization in each country. https://www.msci.com/ The S&P GSCI Crude Oil index provides investors with a reliable and publicly available benchmark for investment performance in the crude oil market. https://us.spindices.com/indices Companies in the S&P 500 Sector Indices are classified based on the Global Industry Classification Standard (GICS®). https://us.spindices.com/indices |


