Weekly Market Commentary
Markets Rebound as S&P 500 Nears Full Recovery on Strong Earnings
Posted on August 22, 2024
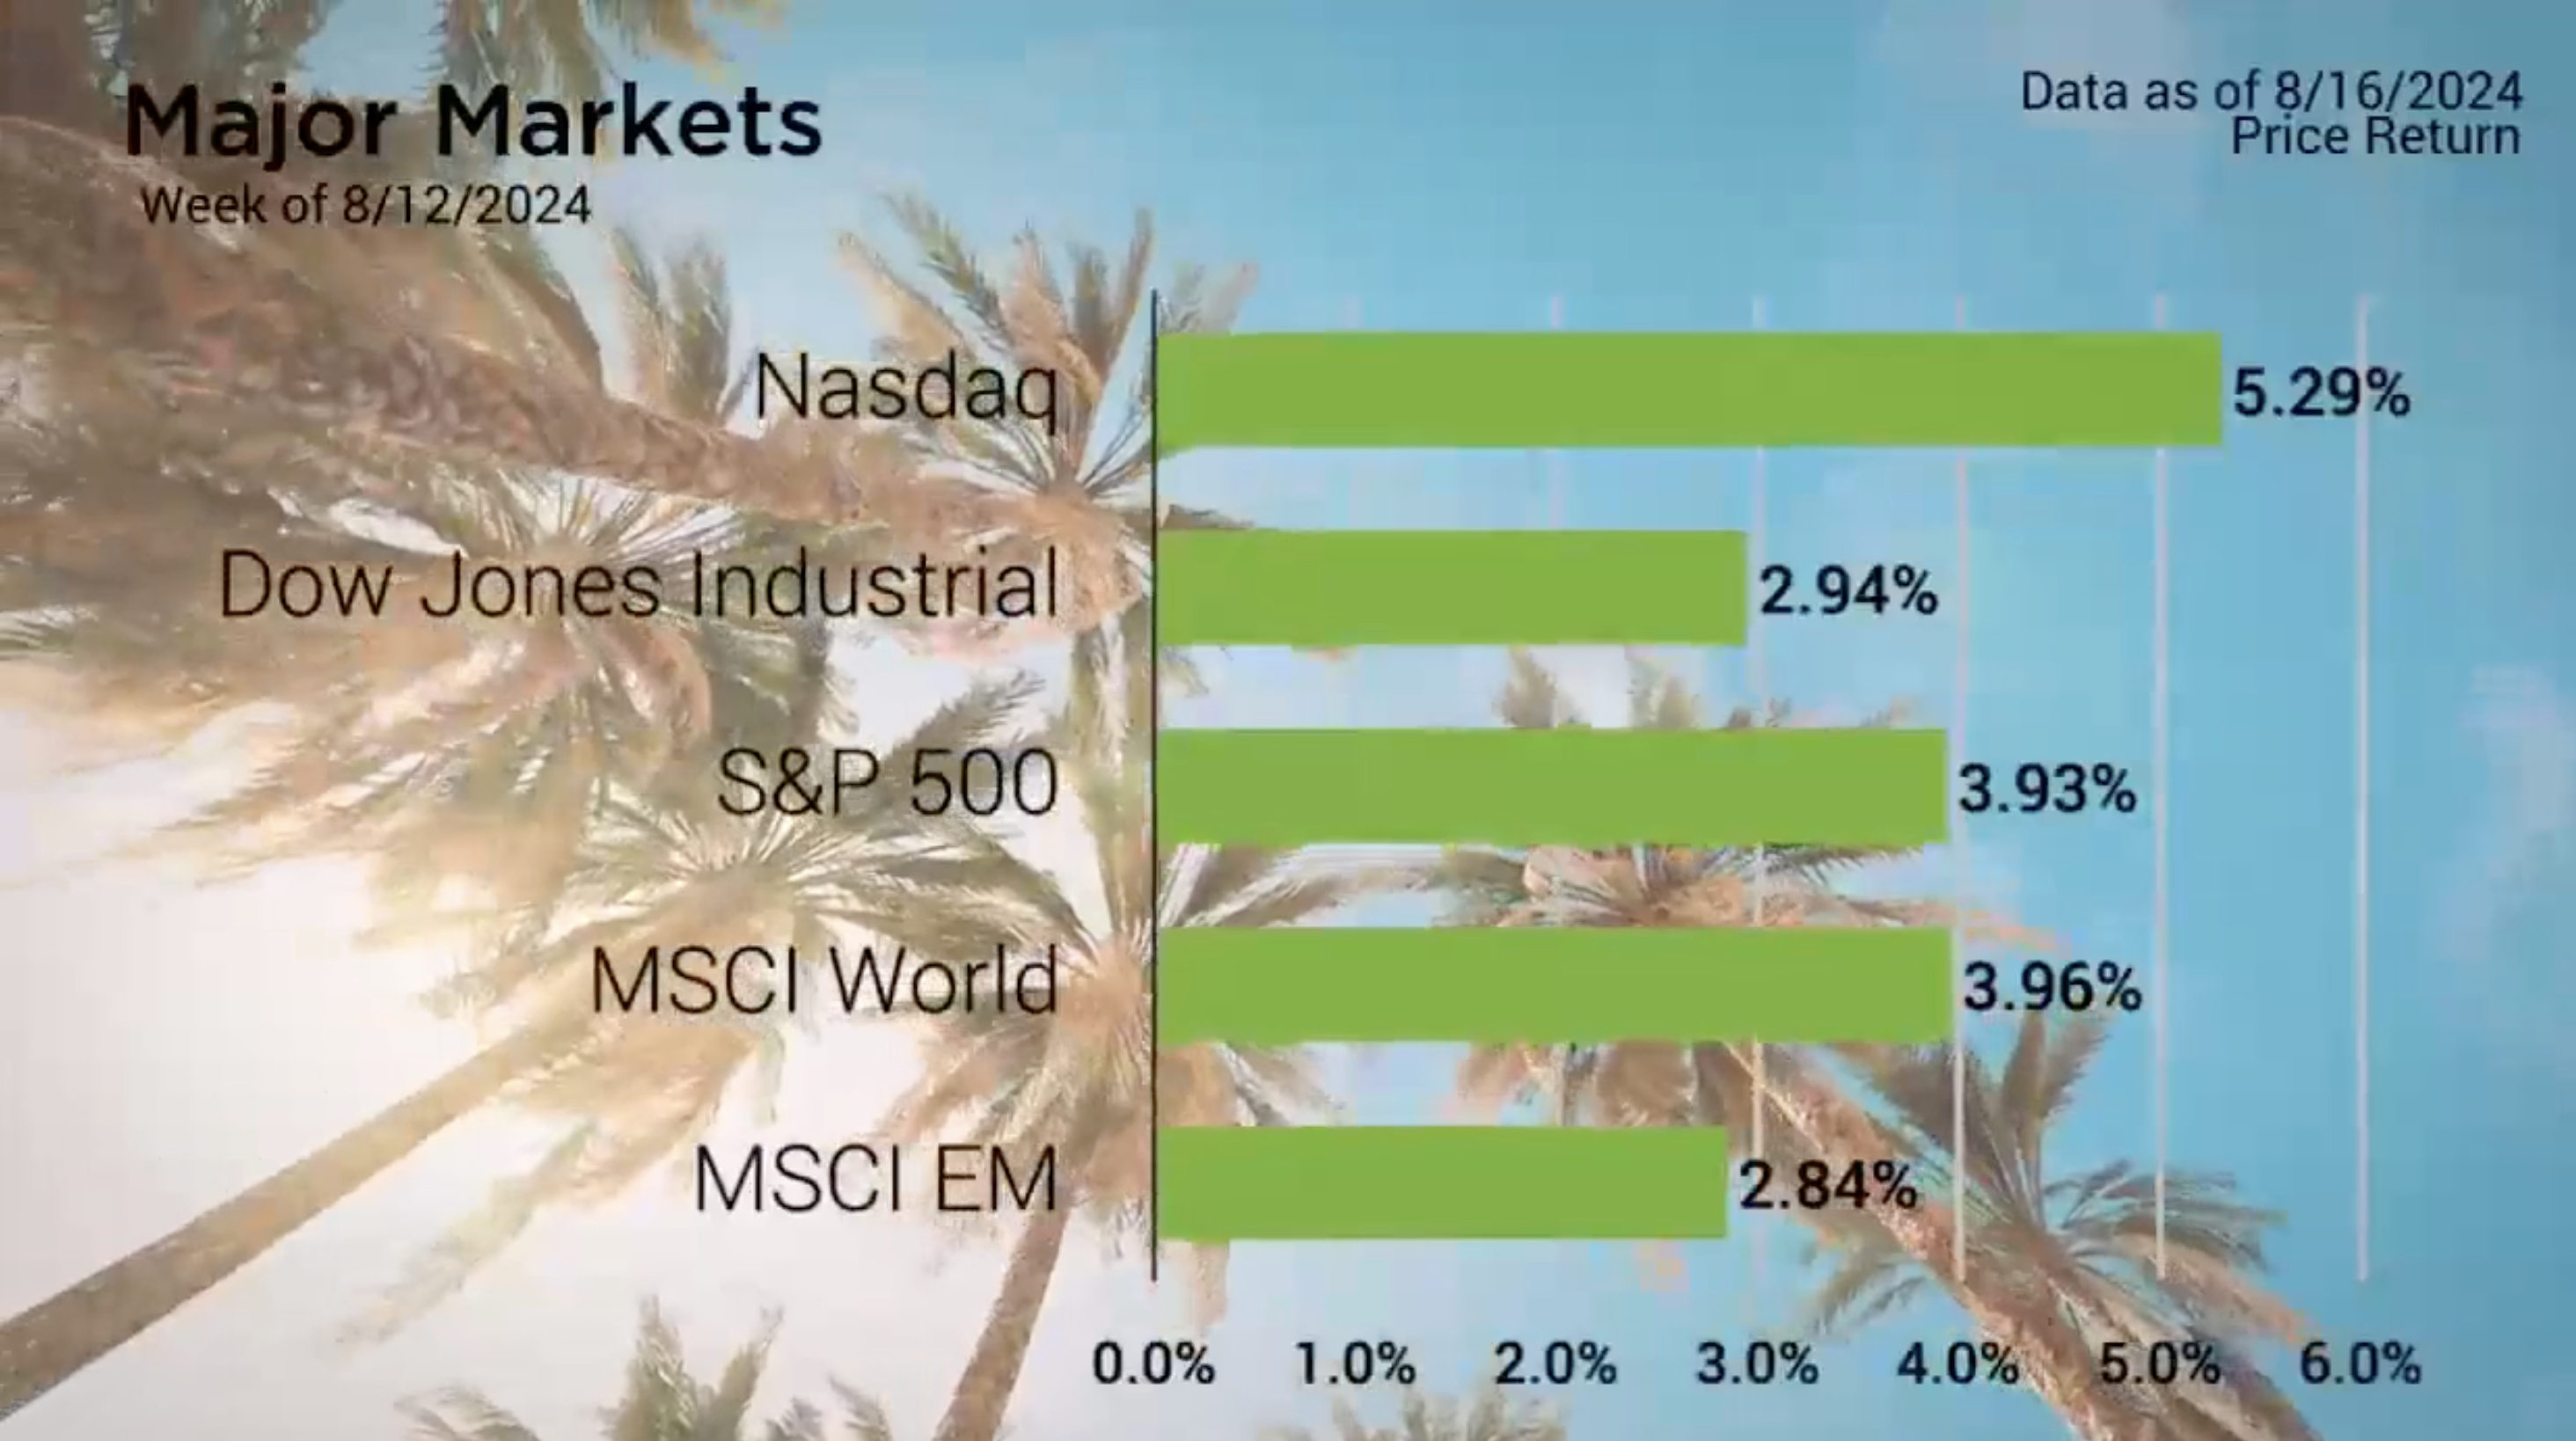
The Major Markets posted solid gains last week, continuing the about face from the mid-summer sell-off. As of Friday’s close, the S&P 500 has recovered all but two percentage points of the drop from July 16th.
The market rebound has been fueled at least in part by a number of generally favorable economic and earnings reports following the early August employment concerns.
The Economic Calendar saw the release of the July Consumer Price Index Wednesday. This came in line with expectations for both the headline report as well as the Core number, month-over-month.
Last week marked the tail end of the Q2 Earnings Result bell curve as over a thousand companies reported their results last week. According to FactSet , 91% of the S&P 500 companies had reported their earnings results going into last week. Of those that had reported, 78% had reported EPS above estimates. This figure exceeds both the 5-year and 10-year averages of 77% and 74% respectively. As FactSet also reported, if the earnings growth rate holds at this current level, it will mark as the highest year-over-year growth rate for the index since Q4 of 2021.

Major Markets |
YTD as of 08/16/2024 | ||
| Nasdaq |  |
||
| Dow Jones Industrial |  |
||
| S&P 500 |  |
||
| MSCI World |  |
||
| MSCI EM |  |
||
| Russell 2000 |  |
||
| Bar US Agg Bnd |  |
||
 |
|||
S&P Sectors |
|
|||||
| Comm. Services |  |
|||||
| Cons. Discretionary |  |
|||||
| Cons. Staples |  |
|||||
| Energy |  |
|||||
| Financials |  |
|||||
| Health Care |  |
|||||
| Industrials |  |
|||||
| Info. Technology |  |
|||||
| Materials |  |
|||||
| Real Estate |  |
|||||
| Utilities |  |
|||||
 |
||||||
| Agent/Broker Dealer Use Only | ||||||
The green of the major markets was also seen at the sector level with every sector closing higher. The Style boxes demonstrated that this recovery was consistent across capitalizations and classifications, with Large Cap Growth returning to the pole position.
Rates remained relatively unchanged with a slight pullback in the longer-term durations of the yield curve. The last couple weeks of market activity has brought some temperance to the rate cut expectations. As of Friday, the CME Group’s Fed Watch Tool has the greater probability of expecting the Fed to cut rate by only 25 basis points at the upcoming meeting in September.
https://insight.factset.com/sp-500-earnings-season-update-august-9-2024
https://www.nytimes.com/2024/08/05/business/stock-market-fed-rate-cut.html
Concerned about inflation? Check out our Tips to Reduce Risks In Case of Recession.
| The S&P 500® Index is a capitalization index of 500 stock-designed to measure performance of the broad domestic economy through changes in the aggregate market value of stock representing all major industries. https://us.spindices.com/indices/equity/sp-500 The Dow Jones Industrial Average® (The Dow®), is a price-weighted measure of 30 U.S. blue-chip companies. The index covers all industries except transportation and utilities. https://us.spindices.com/indices/equity/dow-jones-industrial-average The NASDAQ Composite Index measures all NASDAQ domestic and international based common type stocks listed on The NASDAQ Stock Market. Today the NASDAQ Composite includes over 2,500 companies, more than most other stock market indexes. Because it is so broad-based, the Composite is one of the most widely followed and quoted major market indexes. https://indexes.nasdaqomx.com/Index/Overview/COMP The MSCI World Index, which is part of The Modern Index Strategy, is a broad global equity benchmark that represents large and mid-cap equity performance across 23 developed markets countries. It covers approximately 85% of the free float-adjusted market capitalization in each country and MSCI World benchmark does not offer exposure to emerging markets. The MSCI Emerging Markets (EM) Index is designed to represent the performance of large- and mid-cap securities in 24 Emerging Markets countries of the Americas, Europe, the Middle East, Africa and Asia. As of December 2017, it had more than 830 constituents and covered approximately 85% of the free float-adjusted market capitalization in each country. https://www.msci.com/ The S&P GSCI Crude Oil index provides investors with a reliable and publicly available benchmark for investment performance in the crude oil market. https://us.spindices.com/indices Companies in the S&P 500 Sector Indices are classified based on the Global Industry Classification Standard (GICS®). https://us.spindices.com/indices |


