


 Our Leadership Team
 Find An Advisor
 Our Platform
 Advisory
 Alternatives
 Insurance
 Specialized Services
 Individual Investors
 Retirees
 Business Owners
 Family Offices & Institutions
 Doctors
 Tenants
 Accountants
Weekly Market Commentary
Mixed Market Performances Mark the Mid-Year
Posted on July 3, 2024
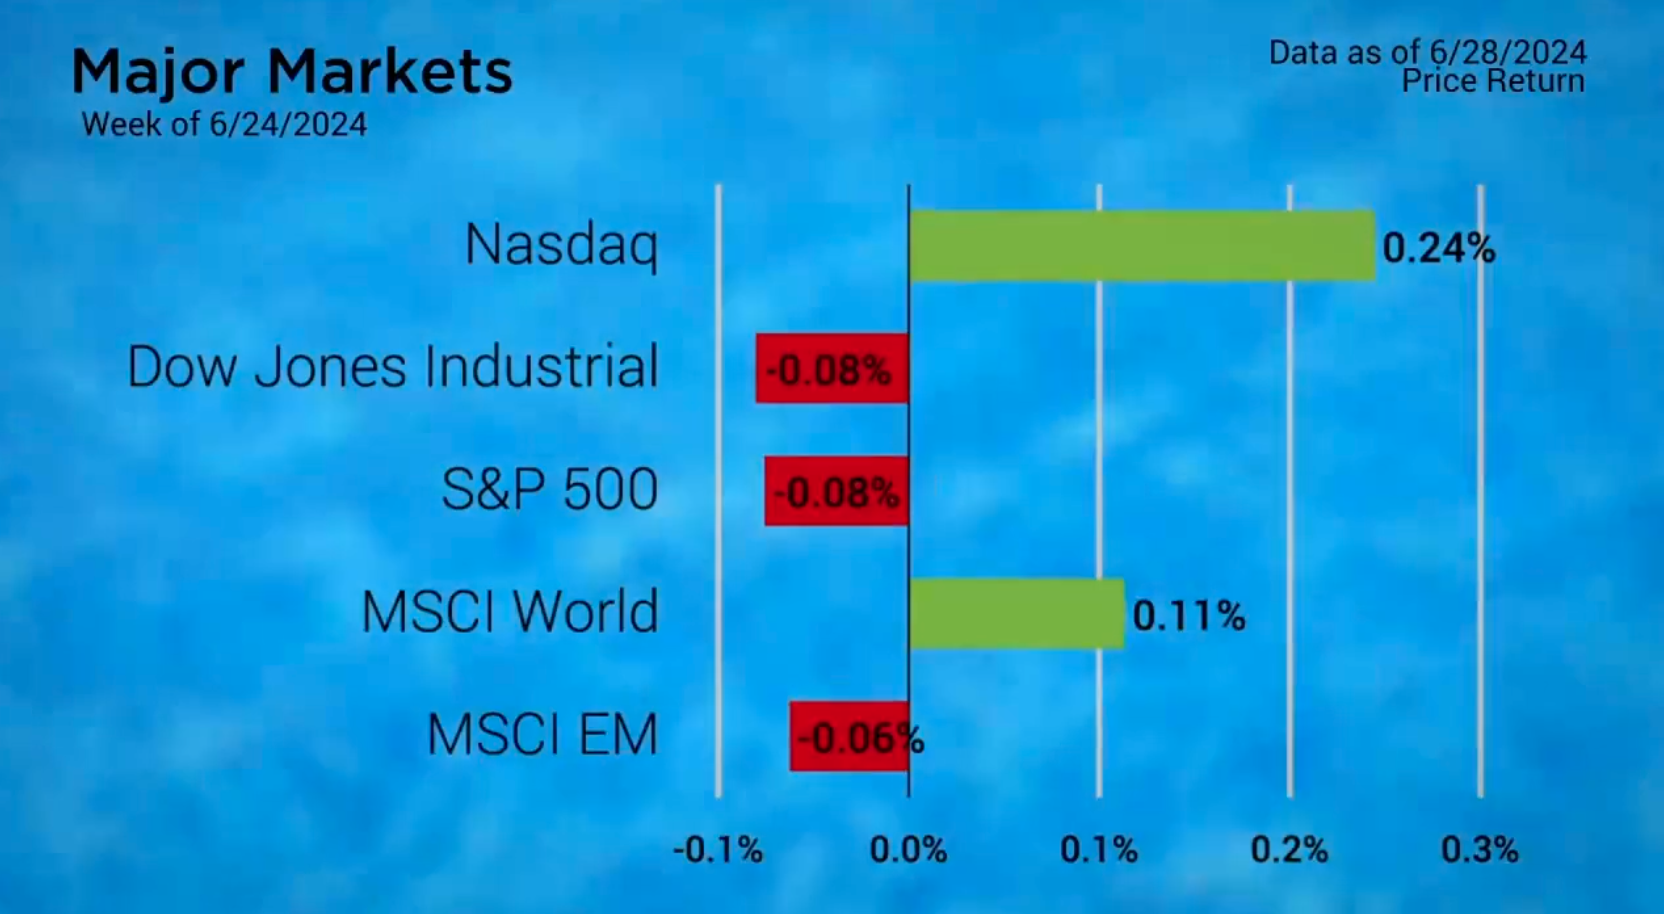
The last week of the first half of the year concluded with mixed results. The NASDAQ and the MSCI World Index both managed to close in positive territory while the S&P 500, Dow Jones and Emerging Market Indices all closed the week lower.
The close of the week gave the S&P 500 another winning month for 2024, adding nearly 3.5% in June. This closed out the first half of the year with a gain of 14.48%. This stands as the best first half performance for the S&P 500 in an election year going back to 1976. Elections were top of mind last week in the first Presidential debate rematch on Thursday of last week.
On the Economic Calendar, Thursday also saw the release of the 2nd revision of the Q1 GDP which remained unchanged at 1.4%. Additionally, May’s Pending Home sales were released which saw a drop of 2.1%. This creates a difficult housing picture when combined with the prior day’s release of the New Home Sales report which fell by 11.3 month over month.
Major Markets |
YTD as of 6/28/2024 | ||
| Nasdaq |  |
||
| Dow Jones Industrial |  |
||
| S&P 500 |  |
||
| MSCI World |  |
||
| MSCI EM |  |
||
| Russell 2000 |  |
||
| Bar US Agg Bnd |  |
||
 |
|||
S&P Sectors |
|
|||||
| Comm. Services |  |
|||||
| Cons. Discretionary |  |
|||||
| Cons. Staples |  |
|||||
| Energy |  |
|||||
| Financials |  |
|||||
| Health Care |  |
|||||
| Industrials |  |
|||||
| Info. Technology |  |
|||||
| Materials |  |
|||||
| Real Estate |  |
|||||
| Utilities |  |
|||||
 |
||||||
| Agent/Broker Dealer Use Only | ||||||
Yet, not all news was bad as Personal Income rose by 0.5% in May, beating estimates. Consumer Sentiment also rose in June with a reading of 68.2.
The year has been generally positive in the equity market. That said some areas have been more successful than others. The NASDAQ remains the top performing index of the Major Markets with a gain over 18%. At the Sector level, the performance imbalance is even greater with Communication Services and Information Technology both exceeding 25% for the first half of the year. Meanwhile, as mentioned earlier, the Real Estate sector has continued to struggle as it stands as the only negative sector.
Finally, the Bond market has been mixed this year. Last week saw rates increase slightly again, setting the Barclays Agg a little more firmly in negative territory. That said, a number of High Yield Bond indices and T-Bills have been able to offset the downward pressure caused by higher interest rates with positive performance.
Concerned about inflation? Check out our Tips to Reduce Risks In Case of Recession.
| The S&P 500® Index is a capitalization index of 500 stock-designed to measure performance of the broad domestic economy through changes in the aggregate market value of stock representing all major industries. https://us.spindices.com/indices/equity/sp-500 The Dow Jones Industrial Average® (The Dow®), is a price-weighted measure of 30 U.S. blue-chip companies. The index covers all industries except transportation and utilities. https://us.spindices.com/indices/equity/dow-jones-industrial-average The NASDAQ Composite Index measures all NASDAQ domestic and international based common type stocks listed on The NASDAQ Stock Market. Today the NASDAQ Composite includes over 2,500 companies, more than most other stock market indexes. Because it is so broad-based, the Composite is one of the most widely followed and quoted major market indexes. https://indexes.nasdaqomx.com/Index/Overview/COMP The MSCI World Index, which is part of The Modern Index Strategy, is a broad global equity benchmark that represents large and mid-cap equity performance across 23 developed markets countries. It covers approximately 85% of the free float-adjusted market capitalization in each country and MSCI World benchmark does not offer exposure to emerging markets. The MSCI Emerging Markets (EM) Index is designed to represent the performance of large- and mid-cap securities in 24 Emerging Markets countries of the Americas, Europe, the Middle East, Africa and Asia. As of December 2017, it had more than 830 constituents and covered approximately 85% of the free float-adjusted market capitalization in each country. https://www.msci.com/ The S&P GSCI Crude Oil index provides investors with a reliable and publicly available benchmark for investment performance in the crude oil market. https://us.spindices.com/indices Companies in the S&P 500 Sector Indices are classified based on the Global Industry Classification Standard (GICS®). https://us.spindices.com/indices |


