Weekly Market Commentary
Nasdaq Hits Record Highs Amid Mixed Markets
Posted on December 12, 2024
Nasdaq Hits Record Highs Amid Mixed Markets
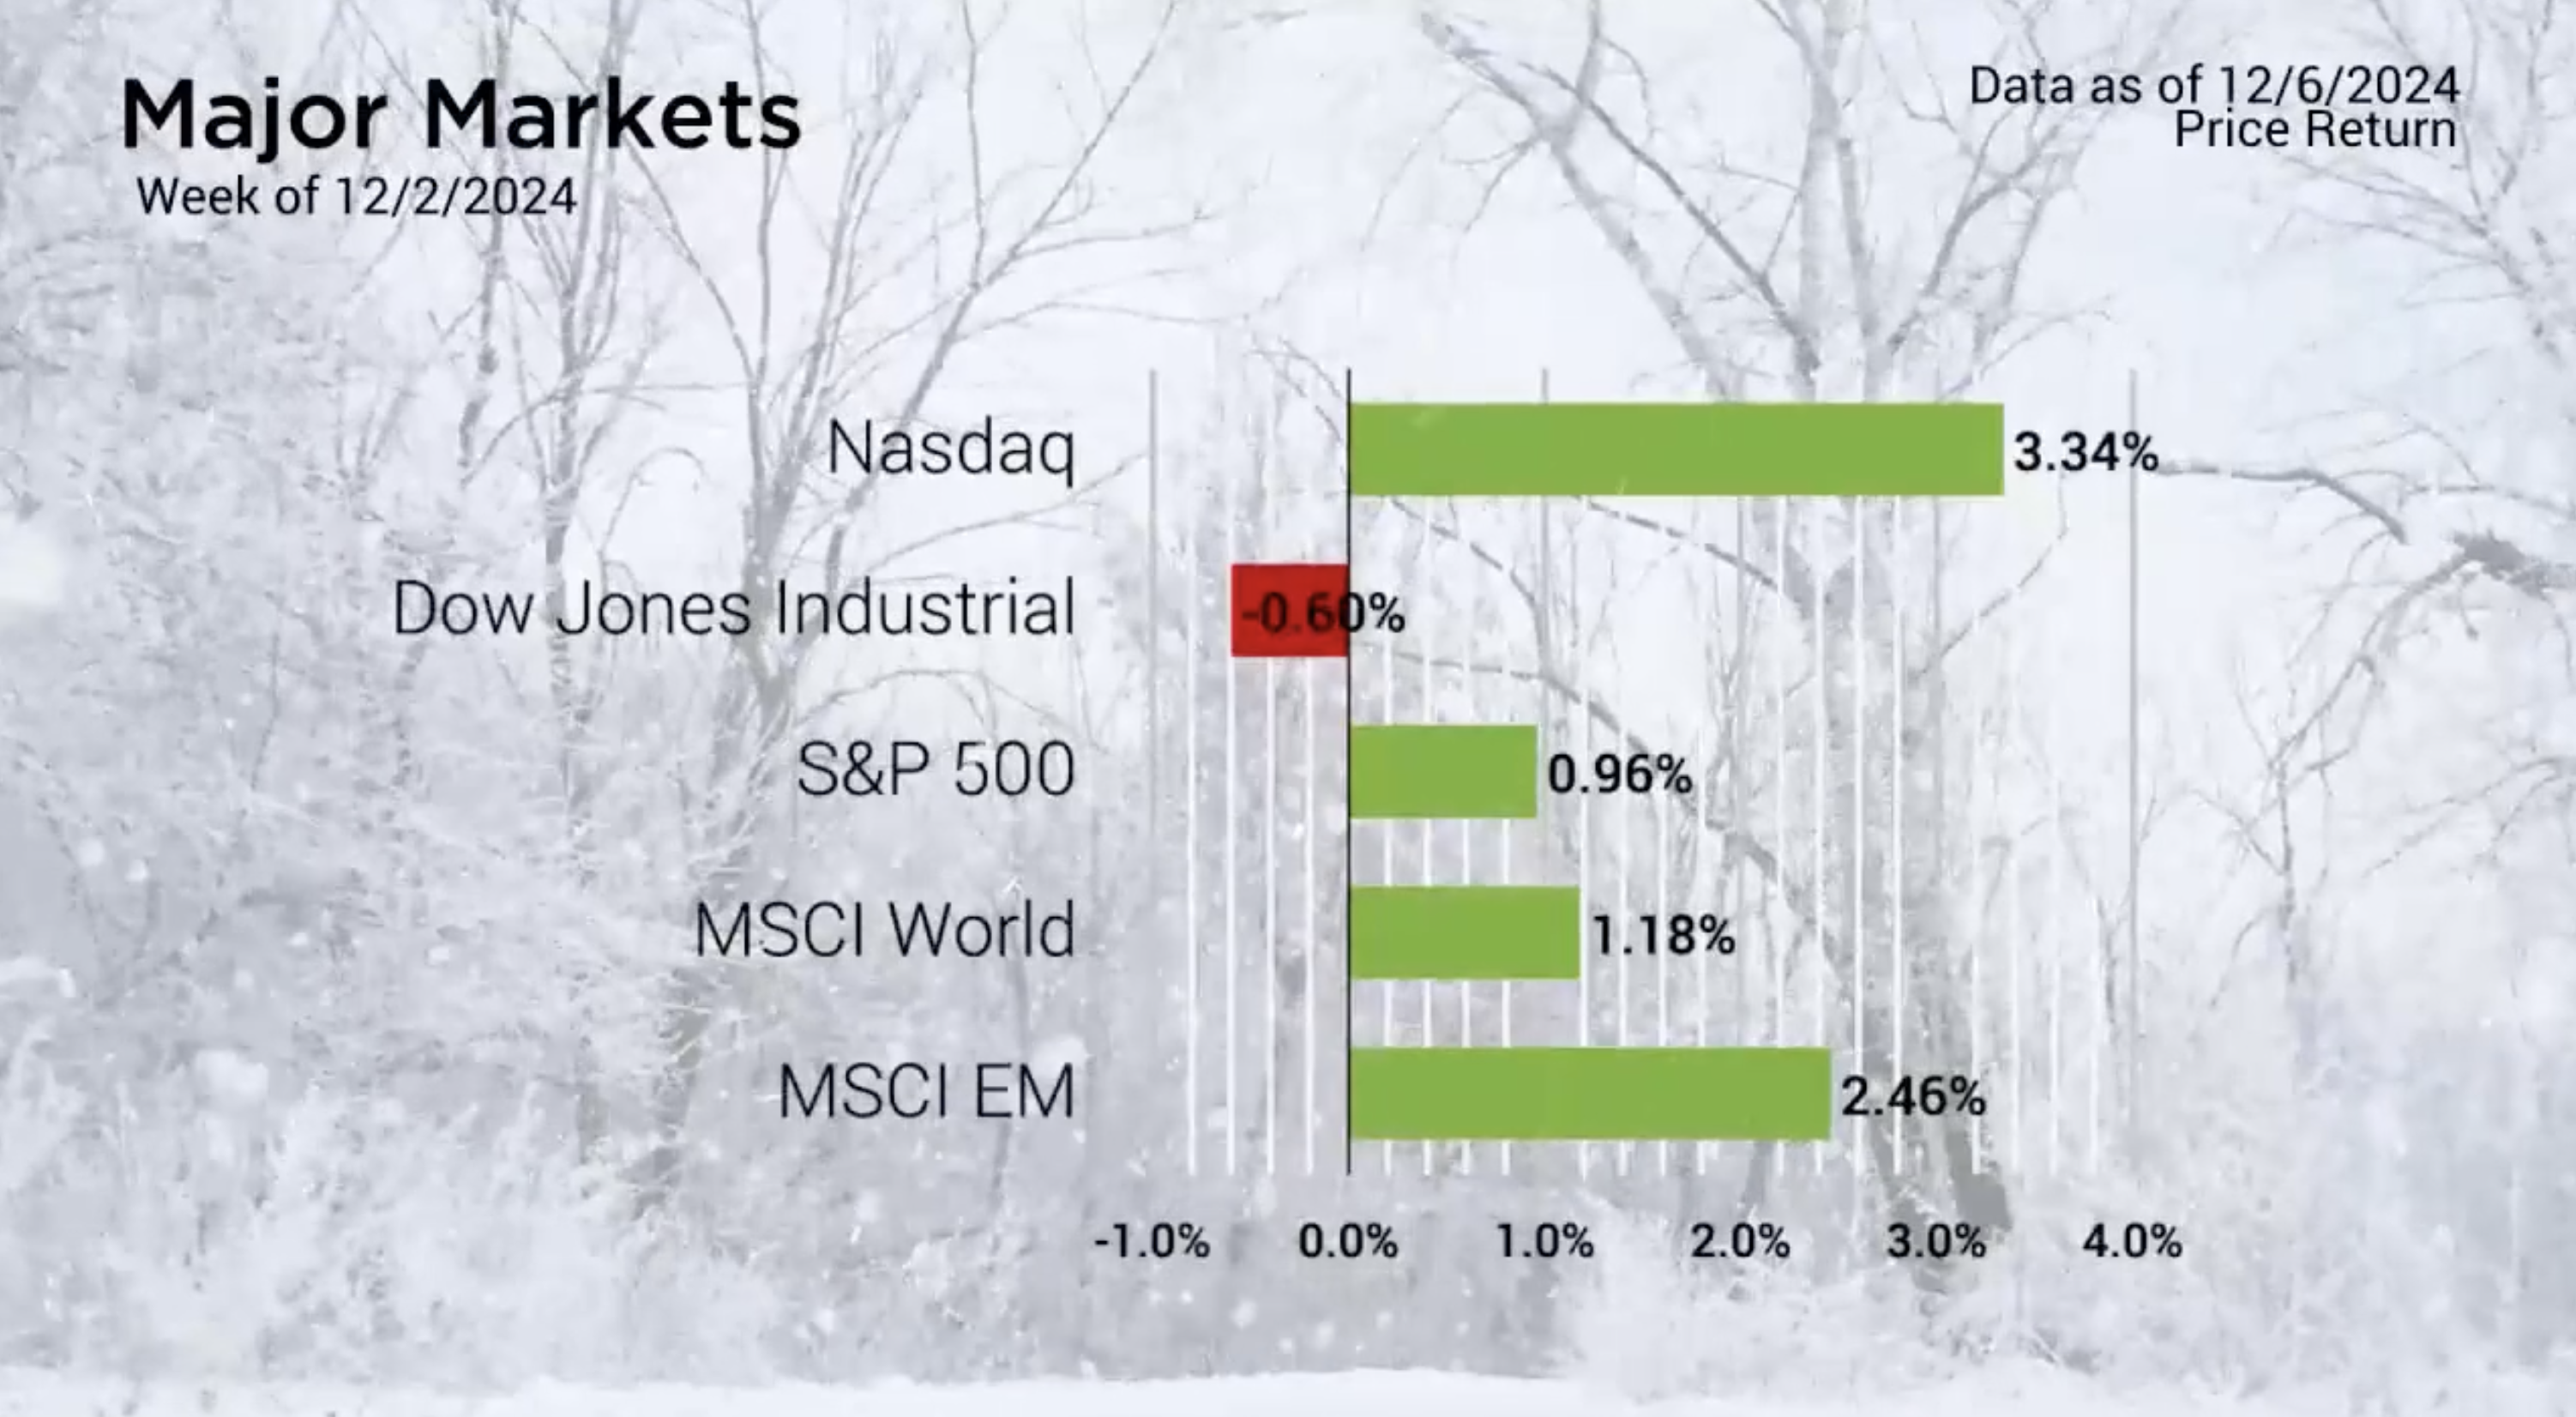
The Major Markets closed the first week of the last month of the year generally positive. The Dow Jones was the notable exception as it gave back around half a percent. The Nasdaq, however, added three- and third-percent last week. The Nasdaq’s dominance as the top performing major benchmark this year was accentuated by 4 of the 5 days last week seeing new all-time closing highs in the index. This brings the total to 36 fresh all-time closing highs for the index this year.
But as seen within the Dow Jones, just because one segment had a strong week, it does not mean that all, or even most of the of domestic market was positive. The S&P 500 sectors highlighted how the gains last week were concentrated in the most dominant weightings of the Nasdaq. Technology makes up just shy of 60% of the Nasdaq Composite with another roughly 20% in Consumer Discretionary. The only other positive performing sector last week was Communication Services which represents another 2.5% of the Nasdaq Composite. The remaining 8 sectors of the S&P 500 all closed in varying amount of red last week.

Major Markets |
YTD as of 12/06/2024 | ||
| Nasdaq |  |
||
| Dow Jones Industrial |  |
||
| S&P 500 |  |
||
| MSCI World |  |
||
| MSCI EM |  |
||
| Russell 2000 |  |
||
| Bar US Agg Bnd |  |
||
 |
|||
S&P Sectors |
|
|||||
| Comm. Services |  |
|||||
| Cons. Discretionary |  |
|||||
| Cons. Staples |  |
|||||
| Energy |  |
|||||
| Financials |  |
|||||
| Health Care |  |
|||||
| Industrials |  |
|||||
| Info. Technology |  |
|||||
| Materials |  |
|||||
| Real Estate |  |
|||||
| Utilities |  |
|||||
 |
||||||
| Agent/Broker Dealer Use Only | ||||||
Treasuries saw the longer end of the yield curve drop off last week with as much as 25 basis points of yield being shed in the intermediate to longer term durations. This had the benefit of stimulating the overall bond market. The Bloomberg Barclays Aggregate Bond index added nearly 1.5% last week, effectively doubled the YTD gain.
Concerned about inflation? Check out our Tips to Reduce Risks In Case of Recession.
| The S&P 500® Index is a capitalization index of 500 stock-designed to measure performance of the broad domestic economy through changes in the aggregate market value of stock representing all major industries. https://us.spindices.com/indices/equity/sp-500 The Dow Jones Industrial Average® (The Dow®), is a price-weighted measure of 30 U.S. blue-chip companies. The index covers all industries except transportation and utilities. https://us.spindices.com/indices/equity/dow-jones-industrial-average The NASDAQ Composite Index measures all NASDAQ domestic and international based common type stocks listed on The NASDAQ Stock Market. Today the NASDAQ Composite includes over 2,500 companies, more than most other stock market indexes. Because it is so broad-based, the Composite is one of the most widely followed and quoted major market indexes. https://indexes.nasdaqomx.com/Index/Overview/COMP The MSCI World Index, which is part of The Modern Index Strategy, is a broad global equity benchmark that represents large and mid-cap equity performance across 23 developed markets countries. It covers approximately 85% of the free float-adjusted market capitalization in each country and MSCI World benchmark does not offer exposure to emerging markets. The MSCI Emerging Markets (EM) Index is designed to represent the performance of large- and mid-cap securities in 24 Emerging Markets countries of the Americas, Europe, the Middle East, Africa and Asia. As of December 2017, it had more than 830 constituents and covered approximately 85% of the free float-adjusted market capitalization in each country. https://www.msci.com/ The S&P GSCI Crude Oil index provides investors with a reliable and publicly available benchmark for investment performance in the crude oil market. https://us.spindices.com/indices Companies in the S&P 500 Sector Indices are classified based on the Global Industry Classification Standard (GICS®). https://us.spindices.com/indices |


