


 Our Leadership Team
 Find An Advisor
 Our Platform
 Advisory
 Alternatives
 Insurance
 Specialized Services
 Individual Investors
 Retirees
 Business Owners
 Family Offices & Institutions
 Doctors
 Tenants
 Accountants
 RIA / Advisor Firms
Weekly Market Commentary
Optimism Returned Across the Equity Market
Posted on July 31, 2023
Market Commentary by Mitchell Wood, Larson COO
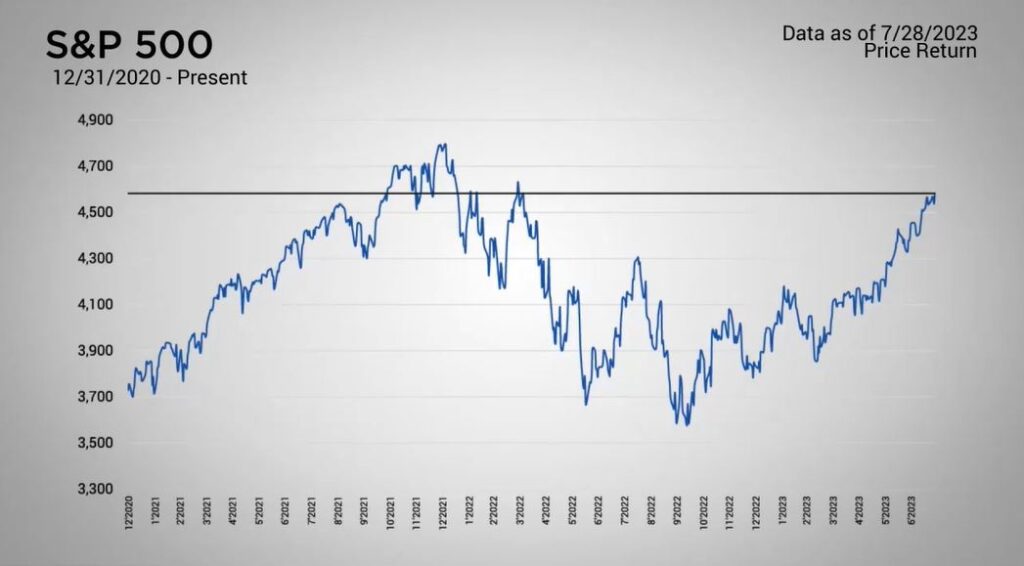
| The Major Markets closed higher across the board last week. Gains ranged from two thirds of a percentage point in the Dow Jones to just over two percentage points in the Nasdaq as optimism returned across the equity market. The domestic market has continued to surprise investors with its ability climb higher despite economic headwinds. The S&P 500 closed the week at its highest level since early April 2022. |
| Since then, the equity market has had to contend with ever increasing interest rates. The first rate-hike began in March of 2022 with a 25-basis point increase. This was followed by 10 more interest rate hikes; the most recent one began last Wednesday. The FOMC raised interest rates another 25-basis points to a target range of 5.25 to 5.5 percent, in line with expectations. Presently, the CME Group anticipates that this will serve as the high-water mark for the Fed Funds rate. The greater probability is that rates will hold at this level for the remainder of the year before the odds indicate a reduction in rates sometime next year. |
As stated earlier, despite these high rates, the economy has continued to remain resilient.
| Last week saw the release of a number of economic reports. The week began with the Manufacturing and Services PMIs, which came in mixed. On Tuesday, the Case-Shiller Home Price Index saw another month-over-month reduction of 1.7 percent, but better than the 1.9 percent expected. Yet, Wednesday’s New Home Sales were below estimates at 697,000, instead of the 725,000 expected. On Thursday, the Q2 GDP report showed an increase of 2.4 percent. This release continued to push back against recession expectations. Finally, the last report of the week was the Consumer Sentiment report for July which came in at 71.6, marking a slight decrease in initial expectations but still well above June’s reading. For treasuries, the week’s activity caused the longer end of the yield curve to rise slightly with the 10 to 30-year durations all seeing a 12-basis point increase in yield. |
Is your financial plan still up to date?
Click “Schedule a Consult” to make sure your money is working for you.
| The S&P 500® Index is a capitalization index of 500 stock-designed to measure performance of the broad domestic economy through changes in the aggregate market value of stock representing all major industries. https://us.spindices.com/indices/equity/sp-500 The Dow Jones Industrial Average® (The Dow®), is a price-weighted measure of 30 U.S. blue-chip companies. The index covers all industries except transportation and utilities. https://us.spindices.com/indices/equity/dow-jones-industrial-average The NASDAQ Composite Index measures all NASDAQ domestic and international based common type stocks listed on The NASDAQ Stock Market. Today the NASDAQ Composite includes over 2,500 companies, more than most other stock market indexes. Because it is so broad-based, the Composite is one of the most widely followed and quoted major market indexes. https://indexes.nasdaqomx.com/Index/Overview/COMP The MSCI World Index, which is part of The Modern Index Strategy, is a broad global equity benchmark that represents large and mid-cap equity performance across 23 developed markets countries. It covers approximately 85% of the free float-adjusted market capitalization in each country and MSCI World benchmark does not offer exposure to emerging markets. The MSCI Emerging Markets (EM) Index is designed to represent the performance of large- and mid-cap securities in 24 Emerging Markets countries of the Americas, Europe, the Middle East, Africa and Asia. As of December 2017, it had more than 830 constituents and covered approximately 85% of the free float-adjusted market capitalization in each country. https://www.msci.com/ The S&P GSCI Crude Oil index provides investors with a reliable and publicly available benchmark for investment performance in the crude oil market. https://us.spindices.com/indices Companies in the S&P 500 Sector Indices are classified based on the Global Industry Classification Standard (GICS®). https://us.spindices.com/indices |


