


 Our Leadership Team
 Find An Advisor
 Our Platform
 Advisory
 Alternatives
 Insurance
 Specialized Services
 Individual Investors
 Retirees
 Business Owners
 Family Offices & Institutions
 Doctors
 Tenants
 Accountants
 RIA / Advisor Firms
News
Navigating Market Volatility: The Power of a Long-Term View
Posted on August 5, 2024
An Update from our Investment Solutions Team
Timeline of Recent Market Events
July 11: Good June CPI Data
CPI fell by -.1% for the month. Housing inflation remains the bugaboo (5.2% annualized over last year and largest weighting). Super Core CPI (CPI that removes energy, food, and shelter) was up 1.8% and below the Fed target of 2%. This is a positive sign as it shows many components of inflation are beginning to slow.[i]
Market Interpretation: Higher probability of the Fed cutting rates in September.
Q2 Earnings Season
Strong Q2. As of 8/2, 75% of companies had reported and 78% beat with a growth rate of 11.5%. Compares favorably to the estimate of 8.9% of June 30. Highest since COVID. GDP Now estimate for Q3 at 2.5%. Both point to soft landing.[ii]
Market Interpretation: Fed might pull off soft landing but there were many growth stocks priced too expensively.
July 31—Israel Attack on Iranian Soil
Israel targeted and killed Hamas leader Ismail Haniyeh on Iranian soil.
Market Interpretation: Fear of a Middle East escalation. Iran is the fourth largest oil producer at 10% of annual global production. However, oil has sold off on larger trade of weakening economy.
July 31: Israel Attack on Iranian Soil
Israel targeted and killed Hamas leader Ismail Haniyeh on Iranian soil.
Market Interpretation: Fear of a Middle East escalation. Iran is the fourth largest oil producer at 10% of annual global production. However, oil has sold off on larger trade of weakening economy.[iii]
August 1: ISM Manufacturing Data
The last manufacturing report printed a new low since COVID of 43.4; anything below 50 is considered a contraction or “recessionary”. On average when the ISM data has historically fallen this low the Fed Fund Rates are ~75bps lower over the next year. Manufacturing is not a large portion of the economy, but a large portion of earnings.[iv]
Market Interpretation: The Fed may have waited too long to lower rates, causing the economy to weaken and creating a bearish environment for equity markets.
August 2: Jobs Report
114k new jobs were added, well below expectations. Unemployment went up to 4.1% from 3.6%. We are still seeing growth in the labor market, but that is slowing as unemployment rises.[v]
Market Interpretation: The Fed may have waited too long to lower rates, causing the economy to weaken and creating a bearish environment for equity markets.
August 5: Japan’s “Black Monday”
Japanese markets fell 10%+ marking the worst day since 1987 following America’s Black Monday. The “carry trade” of using inexpensive Yen to purchase other assets is taking the blame. Also, a strong Yen after the BoJ hiked rates and the Fed looks to cut may hurt export demand. Finally, a weaker US means less demand for export purchases.[vi]
Market Interpretation: Slowing US coupled with technical trading has erased YTD gains in US dollar Japanese returns.
Market Reaction
Volatility Up
Wall Street’s “Fear Gauge”, the VIX (Volatility Index) went from 17 on July 31 to 55 on Aug 5.[vii]
Market Interpretation: Since 1990 the VIX has only crossed 50 in March 2020 and October 2008. We view this sudden spike as investors reacting emotionally and being caught overleveraged in a few concentrated stocks.
Fixed Income Rally
2-year and 10-year treasuries have rallied significantly as market expectations have shifted to more rate cuts. If we use the 2-year yield as the proxy for where the market wants rates and the Fed Funds Rate (where the Fed has rates) the difference widened almost 165bps overnight. This has only happened in 1989, September 1998 (Long-Term Capital), and in January/Feb of 2008.
Market Interpretation: The market is asking for more rate cuts (and likely more than the Fed is willing to give). The truth likely lies in the middle in which the Fed may be behind the ball, but the market is asking for too much too soon.
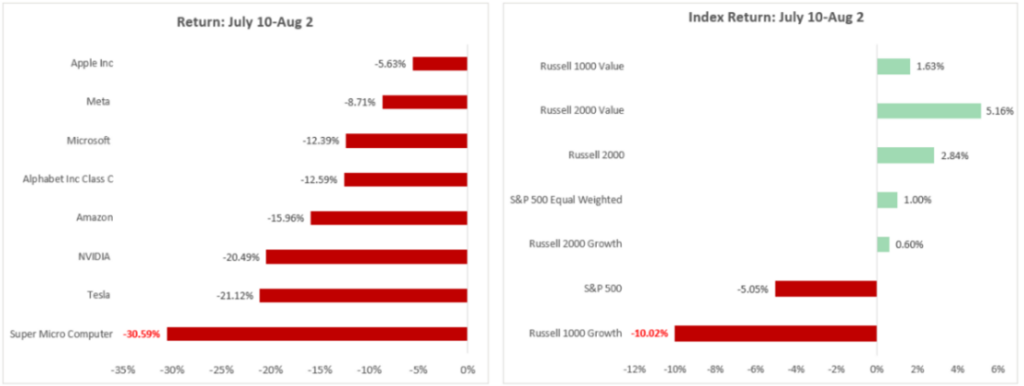
Rotation in Leadership
The darling stocks (Magnificent 7) and other highflyers have pulled back the most. Other risk assets like cryptocurrency have also pulled back considerably. The equal weighted S&P 500 is outperforming the cap weighted S&P 500 by almost 6% in the last month.[viii]
Market Interpretation: Traders are concerned the party is over and want to take some profits off the table.
Portfolio Positioning
Fixed Income Overweight: As of last week, our investment committee elected to increase fixed income duration from short to intermediate. Fixed income is acting defensively during a risk off shift, providing diversification. We believe we’re well positioned to weather volatility.
Small Cap Overweight: Small cap positioning helped us make up ground from July until last week in our equity portfolio. A soft landing with lower rates should serve this positioning well. A hard landing may not add as much benefit.
Long-Term Focused: Our short-term focused commentary above is to provide color around the many questions our clients are asking right now. Our goal remains to be invested through volatility, not around it. Market timing is a fool’s errand.
Capital Markets Assumptions Process: Every month our Capital Markets Team reviews new 10-year CMAs and evaluates if our positioning and market views are materially different enough to compel a change. Should the facts change enough, our opinions may change. However, changes are only made with long-term views in mind while following a consistent and repeatable process. The last thing we want to do is react emotionally to something in a period of increased market volatility.
Navigating Market Volatility
Market volatility has picked up significantly over the last couple of weeks. Tech-heavy equities sold off rapidly, while interest rate sensitive bonds saw a significant rally. While this short-term price action can certainly be unnerving, it is not uncommon for indices to see large intra-year swings, as illustrated below:
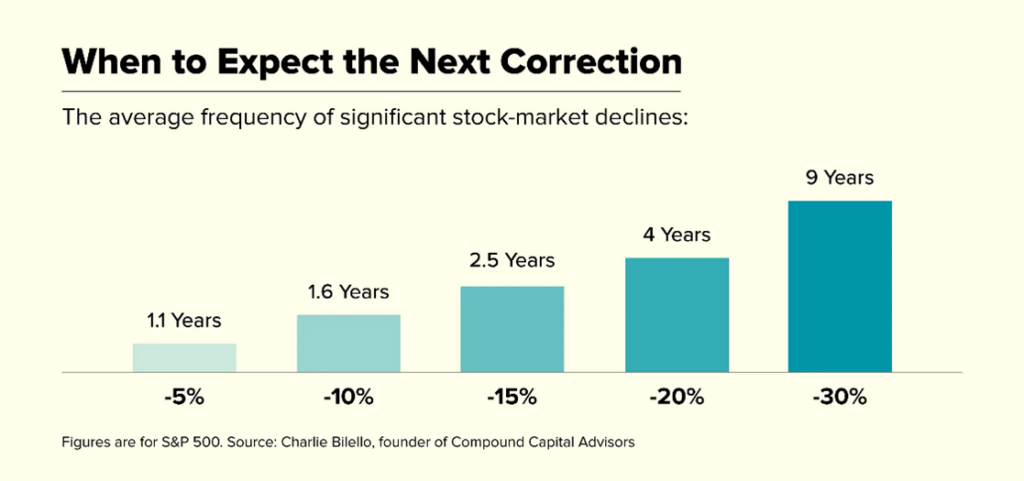
In fact, we see 15% drawdowns in the S&P 500 Index every 2.5 years on average. These tend to come after periods of investor exuberance or when economic or corporate fundamentals begin deteriorating quickly. These times can be uncomfortable but are not something to be feared. We at Larson know to be prepared for periods like this and focus on not making emotional decisions.
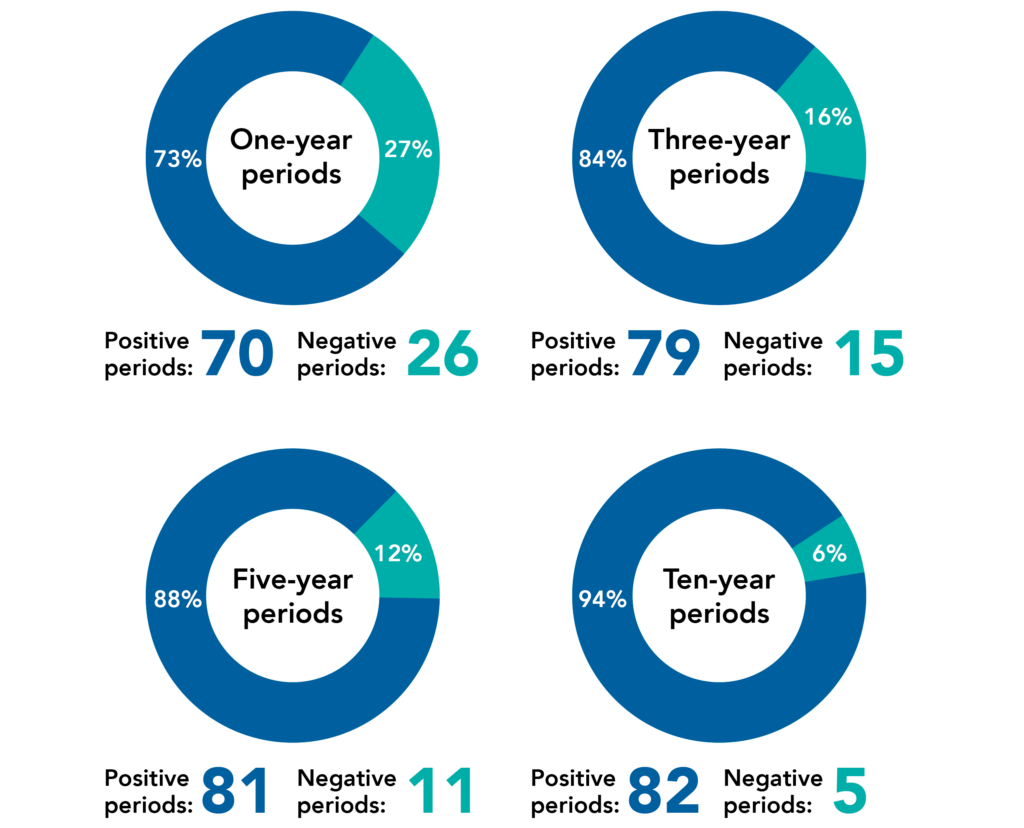
Historically, the market is positive most of the time despite short-term periods of drawdowns. Though it may be cliché, the saying “it’s time in the market, not timing the market” rings true.
Data has shown the longer the period, the greater chance of a positive outcome.
It is important to remember equity markets aren’t some mystical culminations of red and green symbols behind a talking head on T.V. They are simply a collection of companies with management teams trying to grow their businesses. Day-to-day and minute-by-minute movements in stock prices can be just noise without much correlation to the long-term prospects of a company.
Throughout these periods, we continue to abide by our process and, when appropriate, make changes to portfolios offensively versus defensively.
Sam Lawhon,
Director of Investments
These day-to-day movements are driven by a variety of factors, from isolated events at a single company to broader macro-economic pressures. Below, we’ve outlined the most recent series of events we are watching, how the market reacted to them, and the way we are positioned.
Periods of volatility are never fun to go through but are also not uncommon to experience. This most recent bout of volatility was largely technology driven and we do not view it as a systematic threat like we saw in 2008 or March of 2020.
We remain focused on long-term outcomes, knowing that remaining invested over the long term is what historically has driven returns—not reacting to short-term periods of fear. Throughout these periods, we continue to abide by our process and, when appropriate, make changes to portfolios offensively vs defensively.
As always, we appreciate and value your trust.
Your Larson Investment Solutions Team
Download This Article
[i] Bloomberg
[ii] Fact Set, 8/2/2024
[iii] Bloomberg, 8/5/2024
[iv] Bloomberg, 8/5/2024
[v] BLS, 8/2/2024
[vi] Bloomberg, 8/5/2024
[vii] Ycharts, 8/2/2024
[viii] Ycharts, 8/2/2024


