


 Our Leadership Team
 Find An Advisor
 Our Platform
 Advisory
 Alternatives
 Insurance
 Specialized Services
 Individual Investors
 Retirees
 Business Owners
 Family Offices & Institutions
 Doctors
 Tenants
 Accountants
Weekly Market Commentary
Tech Stocks Surge as Major Markets End Week Mostly Higher
Posted on June 18, 2024
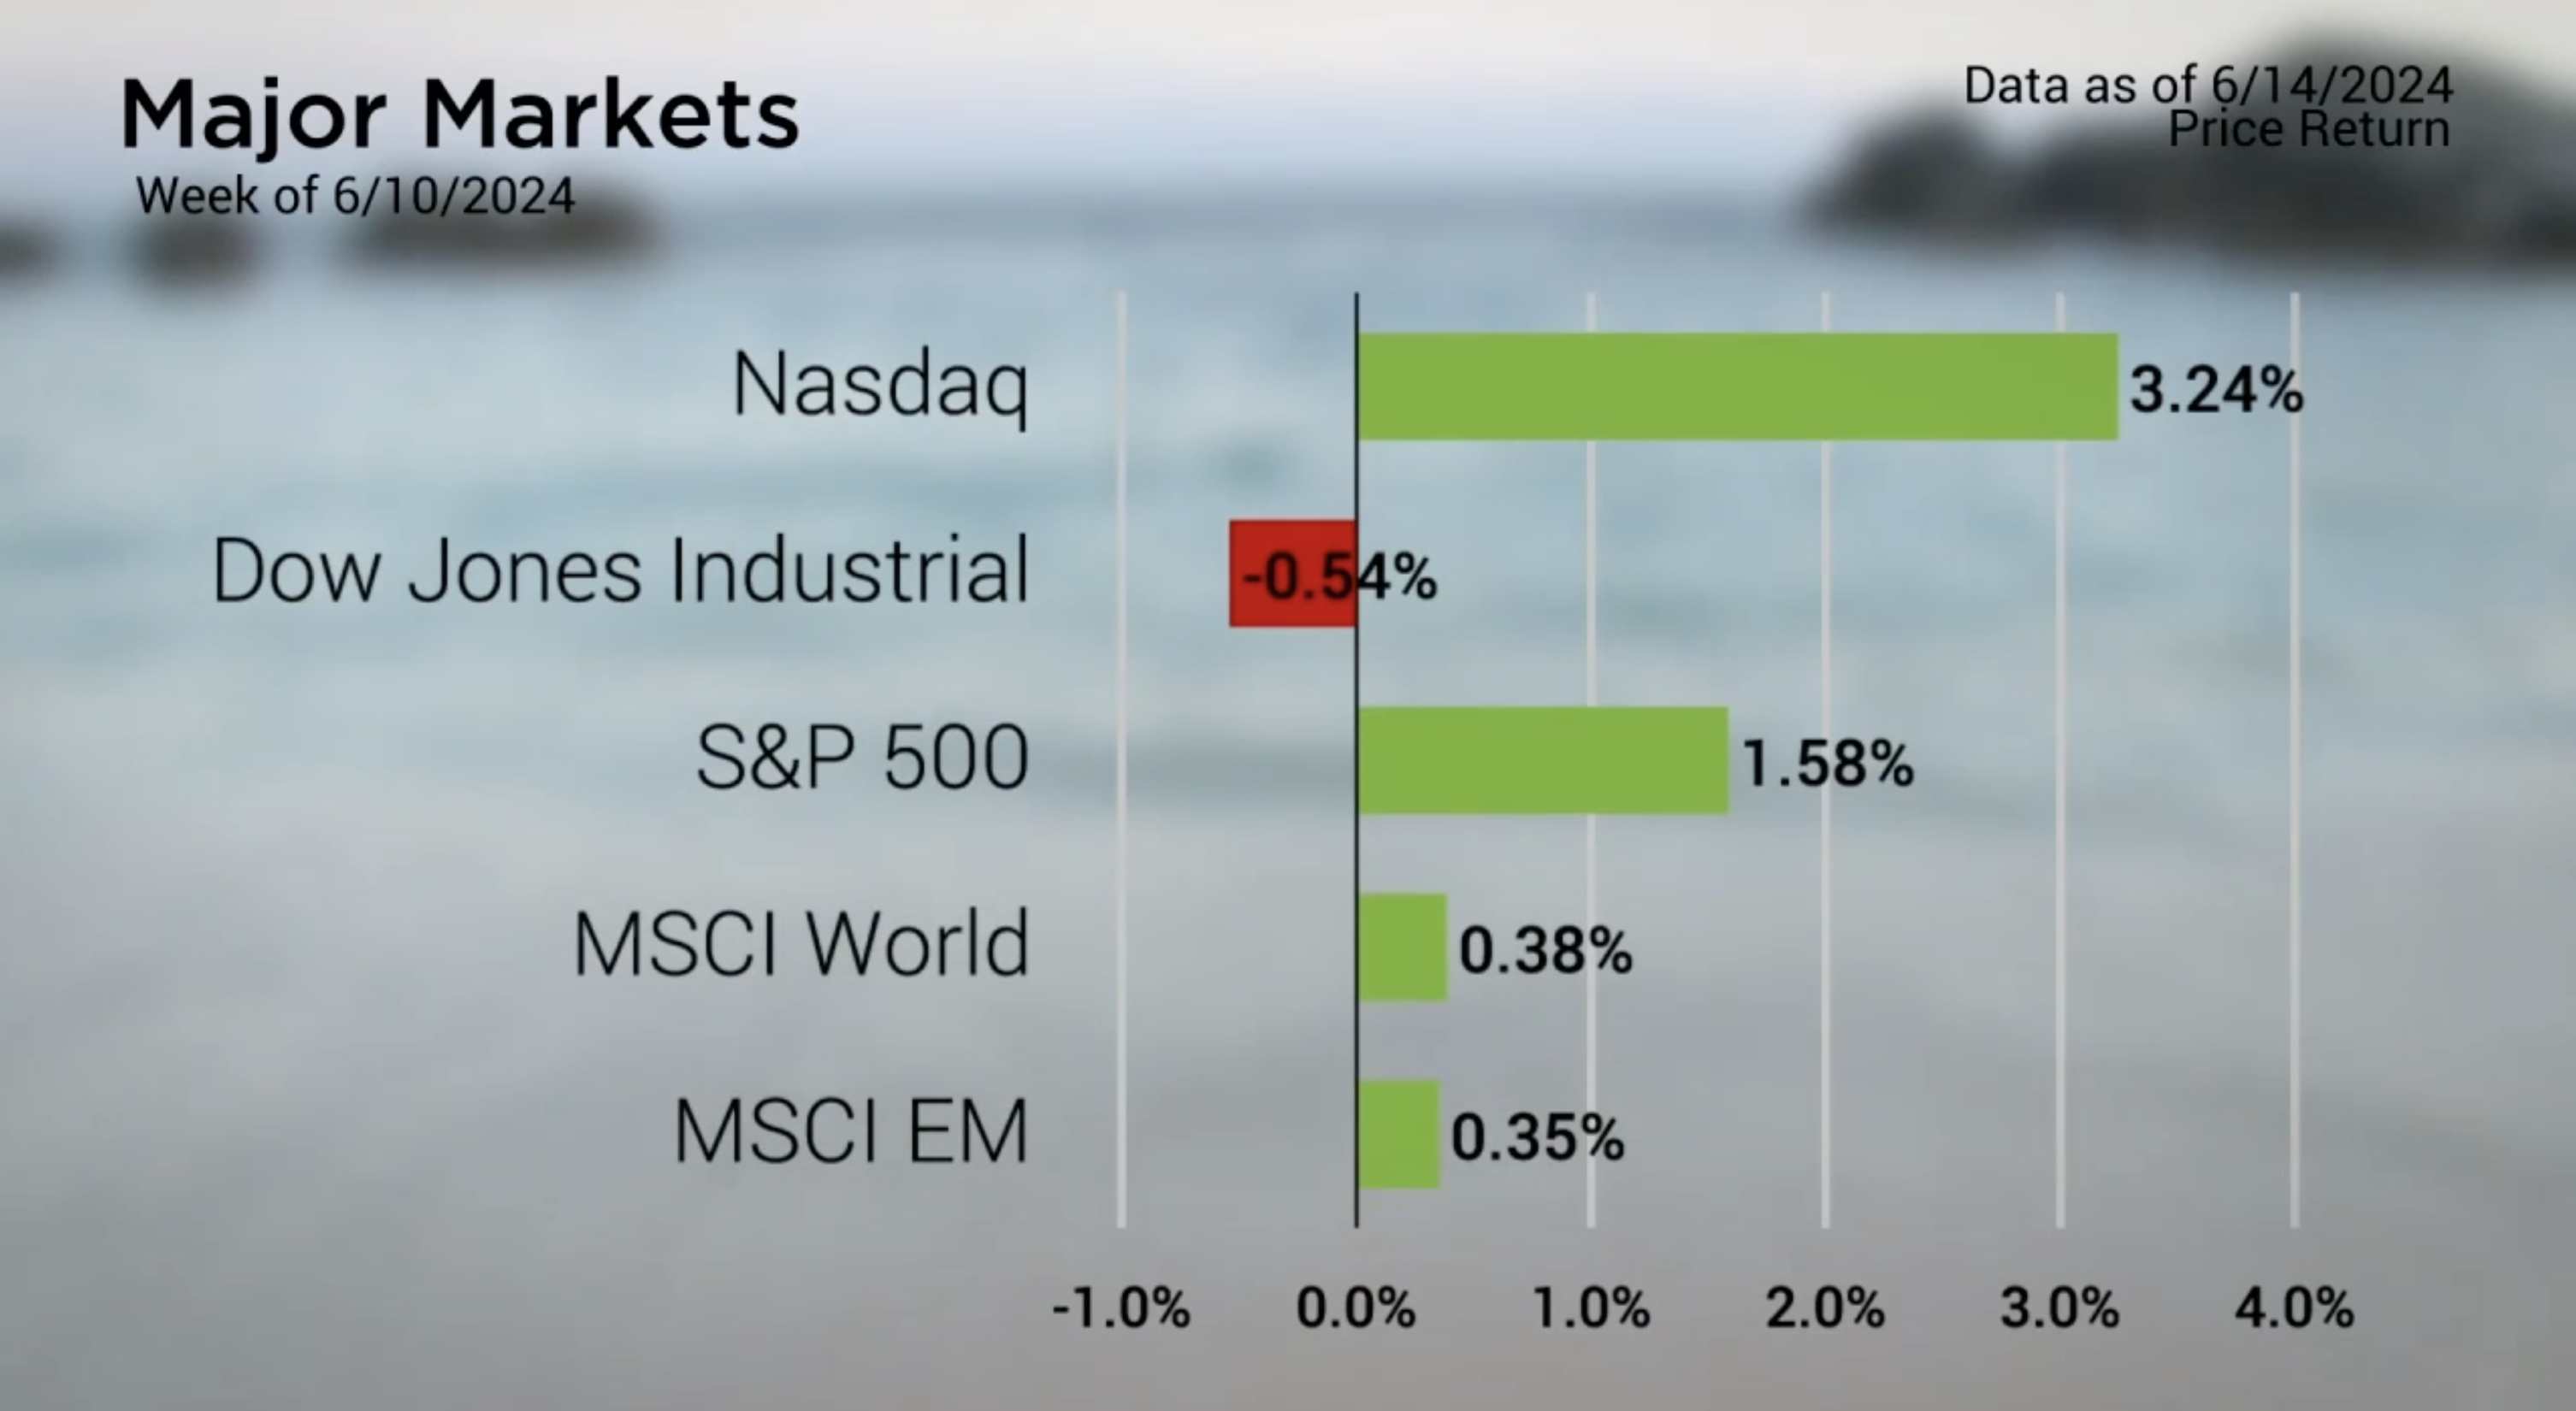
The Major Markets closed mostly higher last week with the Dow Jones Industrial Average the lone index in negative territory. The Nasdaq added roughly three and a quarter percent last week to lead the pack. The S&P 500 was next in line with a gain of over 1.5%. Breaking the S&P 500 down by sector, we see that Information Technology sector was the standout performer with an impressive gain of nearly six and a half percent.
Information Technology’s 61% weighting in the Nasdaq and the 30% weighting in the S&P 500 was the largest contributor to these indices gains. Broadcom and Adobe were two companies that reported earnings at the tail end of the earnings season that managed to further stimulate the top performing sector. This has extended the IT sector’s year to date performance to over 29%.
Like last week, Large Cap Blend and Growth both managed to close positive while the remaining seven style boxes ended lower, further highlighting the continued imbalance in performance. As of Friday’s close, the S&P 500 Growth index sits with an impressive 22- and three-quarter percent gains while Small Cap Value has shed over seven and a half percent.
Major Markets |
YTD as of 6/14/2024 | ||
| Nasdaq |  |
||
| Dow Jones Industrial |  |
||
| S&P 500 |  |
||
| MSCI World |  |
||
| MSCI EM |  |
||
| Russell 2000 |  |
||
| Bar US Agg Bnd |  |
||
 |
|||
S&P Sectors |
|
|||||
| Comm. Services |  |
|||||
| Cons. Discretionary |  |
|||||
| Cons. Staples |  |
|||||
| Energy |  |
|||||
| Financials |  |
|||||
| Health Care |  |
|||||
| Industrials |  |
|||||
| Info. Technology |  |
|||||
| Materials |  |
|||||
| Real Estate |  |
|||||
| Utilities |  |
|||||
 |
||||||
| Agent/Broker Dealer Use Only | ||||||
In Economic News, the FOMC held their June meeting. As expected, there was no change in interest rates. During the meeting, the Fed released their updated Dot plot which showed rate expectations consolidated between the 5 to 5.25% and the 4.75% to 5.00% ranges. This implies that the committee is effectively split between one or two 25 basis point cuts by the end of the year, with some even still expecting no changes. This is a significant departure from expectation coming into this year from December. At the end of last year, expectations ranged from unchanged at the current 525-550 basis point level to as low as 3.75 to 4.00%.
By the end of the week, Treasuries dropped with the yield curve falling as much as 25 basis points week-over-week.
Concerned about inflation? Check out our Tips to Reduce Risks In Case of Recession.
| The S&P 500® Index is a capitalization index of 500 stock-designed to measure performance of the broad domestic economy through changes in the aggregate market value of stock representing all major industries. https://us.spindices.com/indices/equity/sp-500 The Dow Jones Industrial Average® (The Dow®), is a price-weighted measure of 30 U.S. blue-chip companies. The index covers all industries except transportation and utilities. https://us.spindices.com/indices/equity/dow-jones-industrial-average The NASDAQ Composite Index measures all NASDAQ domestic and international based common type stocks listed on The NASDAQ Stock Market. Today the NASDAQ Composite includes over 2,500 companies, more than most other stock market indexes. Because it is so broad-based, the Composite is one of the most widely followed and quoted major market indexes. https://indexes.nasdaqomx.com/Index/Overview/COMP The MSCI World Index, which is part of The Modern Index Strategy, is a broad global equity benchmark that represents large and mid-cap equity performance across 23 developed markets countries. It covers approximately 85% of the free float-adjusted market capitalization in each country and MSCI World benchmark does not offer exposure to emerging markets. The MSCI Emerging Markets (EM) Index is designed to represent the performance of large- and mid-cap securities in 24 Emerging Markets countries of the Americas, Europe, the Middle East, Africa and Asia. As of December 2017, it had more than 830 constituents and covered approximately 85% of the free float-adjusted market capitalization in each country. https://www.msci.com/ The S&P GSCI Crude Oil index provides investors with a reliable and publicly available benchmark for investment performance in the crude oil market. https://us.spindices.com/indices Companies in the S&P 500 Sector Indices are classified based on the Global Industry Classification Standard (GICS®). https://us.spindices.com/indices |


