


 Our Leadership Team
 Find An Advisor
 Our Platform
 Advisory
 Alternatives
 Insurance
 Specialized Services
 Individual Investors
 Retirees
 Business Owners
 Family Offices & Institutions
 Doctors
 Tenants
 Accountants
Weekly Market Commentary
Yen Surge and Volatility Shake Markets
Posted on August 16, 2024
It was a volatile week in the market last week despite the final returns in the Major Markets. While each of five indices closed the week with less than a percentage point difference from the prior Friday, the markets took a bit of a wild ride to get there.
The week began with headlines about how the Yen had strengthened relative to the Dollar after the Bank of Japan rose their interest rates above the 0-0.1% range for the first time since 2008. This, combined with the last few weeks of losses in the Nasdaq and the Large Cap growth segments of the markets, caused a stir ahead of the open.
As a result, the S&P 500, opened with the largest drop from the prior close since the Covid Included market volatility in March 2020. This was possibly better seen with the use of the VIX index. The CBOE Volatility Index or VIX, reached 65.73 at its highest before cooling off, the longer the week progressed.
Much like a spring thunderstorm, the volatility left as quickly as it came. By the end of the week the S&P 500 had recovered nearly all the losses from the week.
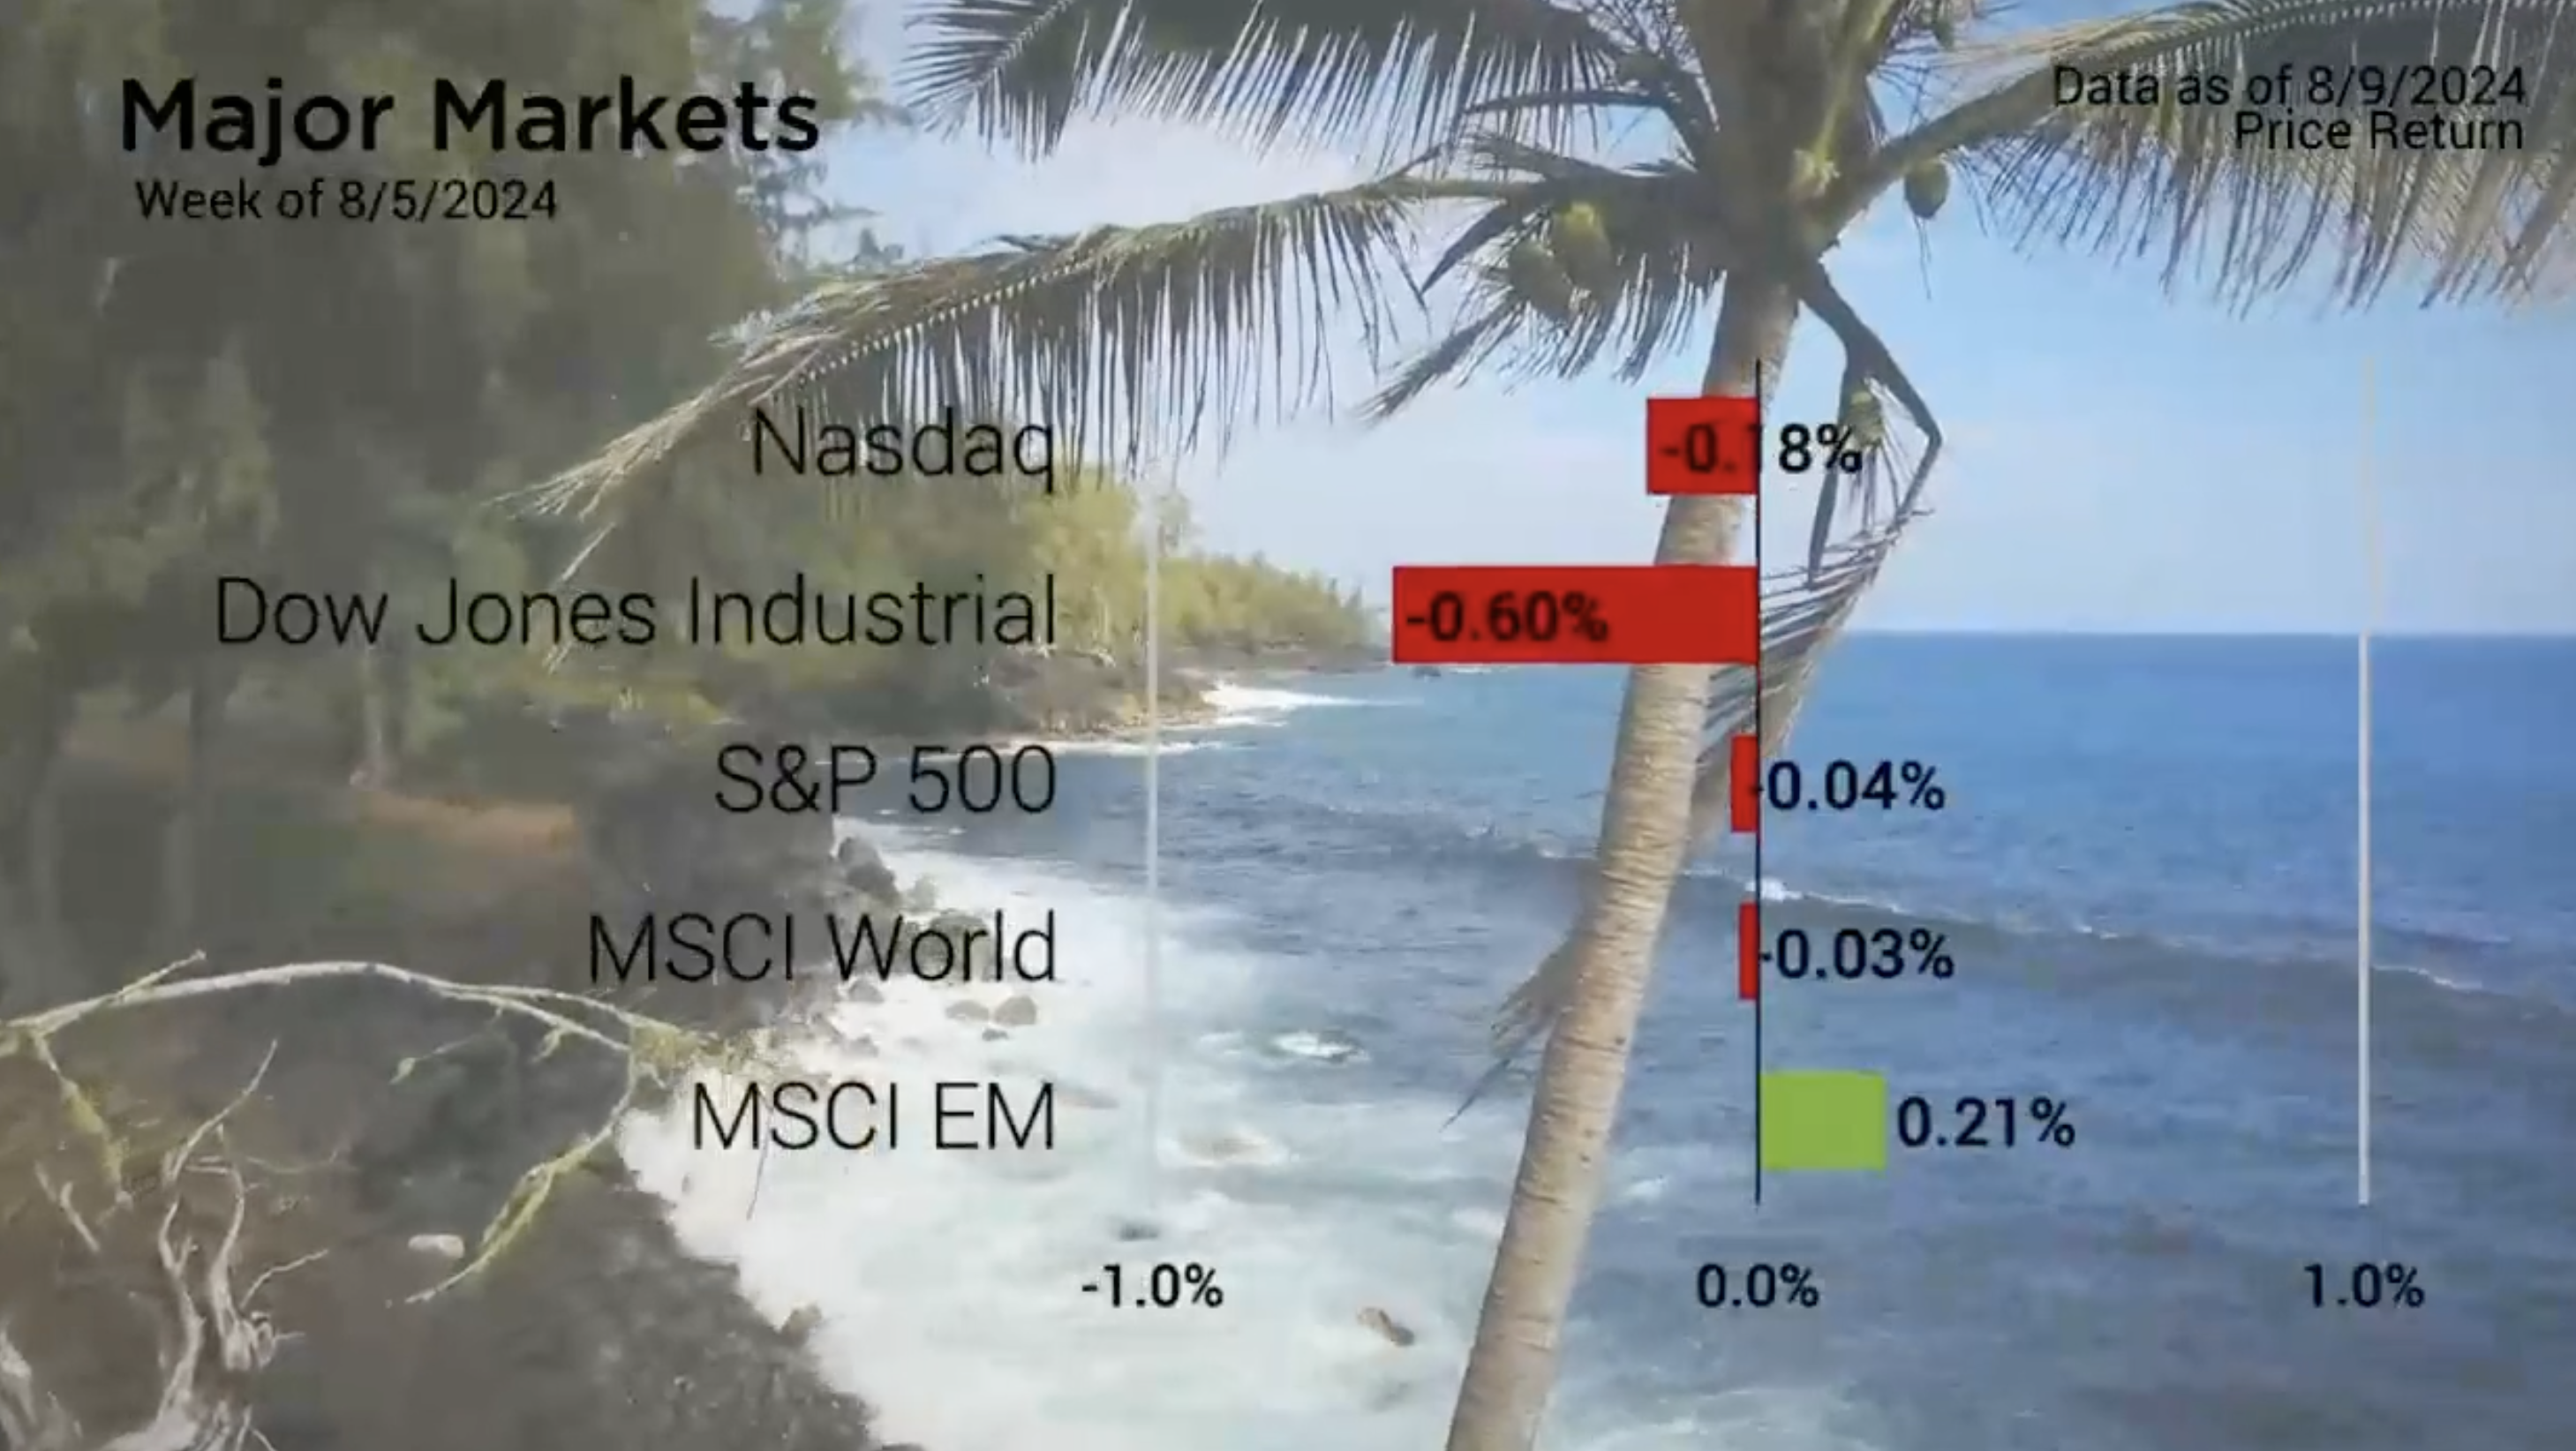
Major Markets |
YTD as of 8/09/2024 | ||
| Nasdaq |  |
||
| Dow Jones Industrial |  |
||
| S&P 500 |  |
||
| MSCI World |  |
||
| MSCI EM |  |
||
| Russell 2000 |  |
||
| Bar US Agg Bnd |  |
||
 |
|||
S&P Sectors |
|
|||||
| Comm. Services |  |
|||||
| Cons. Discretionary |  |
|||||
| Cons. Staples |  |
|||||
| Energy |  |
|||||
| Financials |  |
|||||
| Health Care |  |
|||||
| Industrials |  |
|||||
| Info. Technology |  |
|||||
| Materials |  |
|||||
| Real Estate |  |
|||||
| Utilities |  |
|||||
 |
||||||
| Agent/Broker Dealer Use Only | ||||||
The week’s volatility pulled at all members of the style boxes. However, Large Cap Growth benefitted from a general sentiment that the recent weekly losses from the last and prior weeks caused this segment to drop too far too fast and helped to give the S&P 500 Growth index some gains by the close of the week. The remainder of the Style boxes closed lower overall.
Some on the street had speculated that the Fed might step in and make an emergency rate cut, a proposition that seemed surprising given that the FOMC had just met the week prior . Nevertheless, the yield curve actually rose overall week-over-week, as the five-year added 18 basis points.
This activity caused bond indices to fall generally with the Bloomberg Barclays Aggregate bond index giving back over three quarters of a percentage point.
https://www.nytimes.com/2024/08/05/business/stock-market-fed-rate-cut.html
Concerned about inflation? Check out our Tips to Reduce Risks In Case of Recession.
| The S&P 500® Index is a capitalization index of 500 stock-designed to measure performance of the broad domestic economy through changes in the aggregate market value of stock representing all major industries. https://us.spindices.com/indices/equity/sp-500 The Dow Jones Industrial Average® (The Dow®), is a price-weighted measure of 30 U.S. blue-chip companies. The index covers all industries except transportation and utilities. https://us.spindices.com/indices/equity/dow-jones-industrial-average The NASDAQ Composite Index measures all NASDAQ domestic and international based common type stocks listed on The NASDAQ Stock Market. Today the NASDAQ Composite includes over 2,500 companies, more than most other stock market indexes. Because it is so broad-based, the Composite is one of the most widely followed and quoted major market indexes. https://indexes.nasdaqomx.com/Index/Overview/COMP The MSCI World Index, which is part of The Modern Index Strategy, is a broad global equity benchmark that represents large and mid-cap equity performance across 23 developed markets countries. It covers approximately 85% of the free float-adjusted market capitalization in each country and MSCI World benchmark does not offer exposure to emerging markets. The MSCI Emerging Markets (EM) Index is designed to represent the performance of large- and mid-cap securities in 24 Emerging Markets countries of the Americas, Europe, the Middle East, Africa and Asia. As of December 2017, it had more than 830 constituents and covered approximately 85% of the free float-adjusted market capitalization in each country. https://www.msci.com/ The S&P GSCI Crude Oil index provides investors with a reliable and publicly available benchmark for investment performance in the crude oil market. https://us.spindices.com/indices Companies in the S&P 500 Sector Indices are classified based on the Global Industry Classification Standard (GICS®). https://us.spindices.com/indices |


